Immigrants from Nicaragua vs Scandinavian 10th Grade
COMPARE
Immigrants from Nicaragua
Scandinavian
10th Grade
10th Grade Comparison
Immigrants from Nicaragua
Scandinavians
89.5%
10TH GRADE
0.0/ 100
METRIC RATING
327th/ 347
METRIC RANK
95.6%
10TH GRADE
100.0/ 100
METRIC RATING
19th/ 347
METRIC RANK
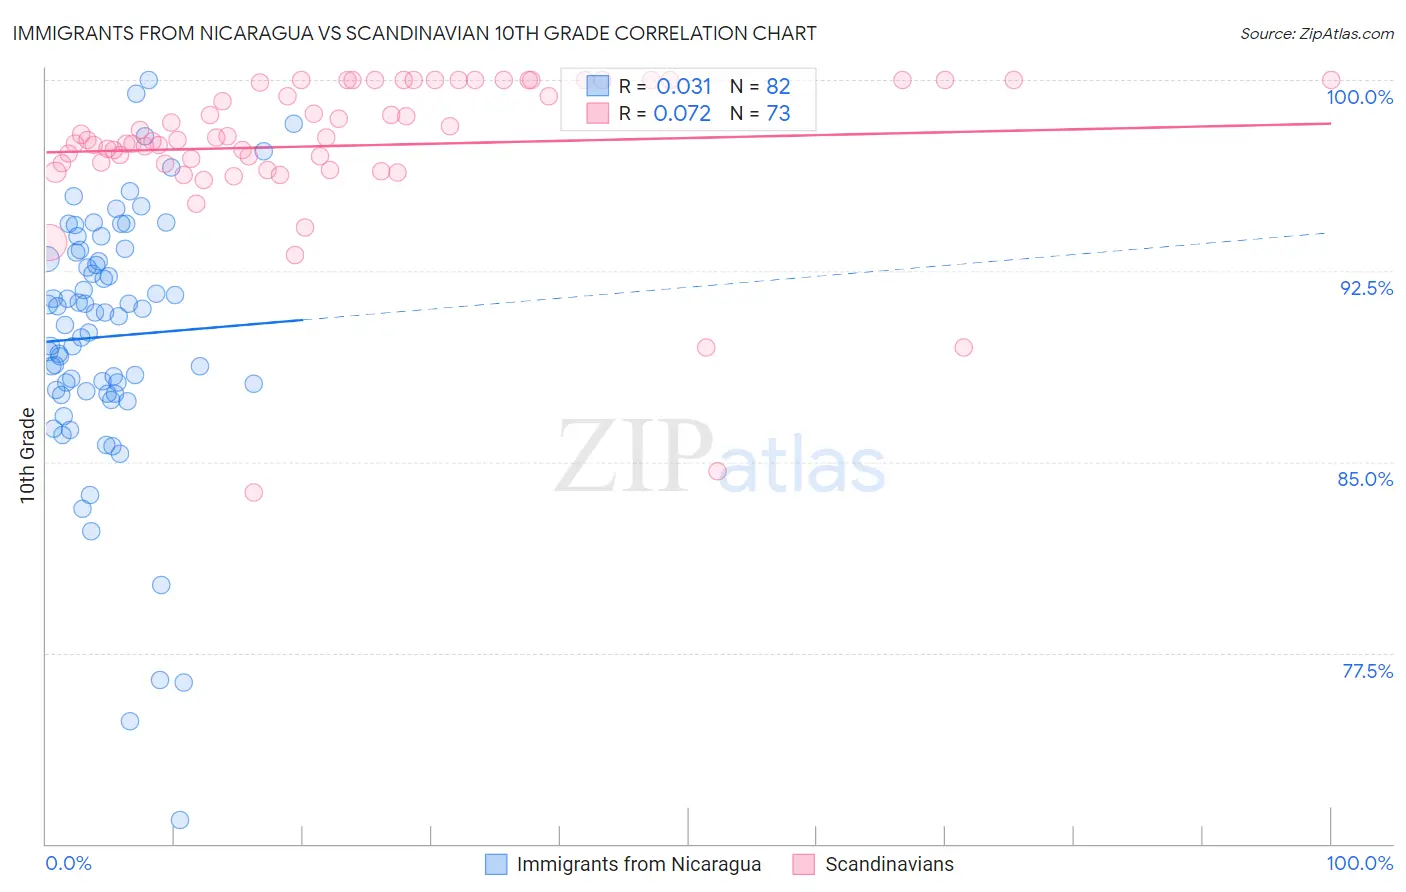
Immigrants from Nicaragua vs Scandinavian 10th Grade Correlation Chart
The statistical analysis conducted on geographies consisting of 236,340,506 people shows no correlation between the proportion of Immigrants from Nicaragua and percentage of population with at least 10th grade education in the United States with a correlation coefficient (R) of 0.031 and weighted average of 89.5%. Similarly, the statistical analysis conducted on geographies consisting of 472,660,435 people shows a slight positive correlation between the proportion of Scandinavians and percentage of population with at least 10th grade education in the United States with a correlation coefficient (R) of 0.072 and weighted average of 95.6%, a difference of 6.8%.
10th Grade Correlation Summary
| Measurement | Immigrants from Nicaragua | Scandinavian |
| Minimum | 70.9% | 83.8% |
| Maximum | 100.0% | 100.0% |
| Range | 29.1% | 16.2% |
| Mean | 89.9% | 97.4% |
| Median | 90.8% | 97.6% |
| Interquartile 25% (IQ1) | 87.8% | 96.7% |
| Interquartile 75% (IQ3) | 93.2% | 100.0% |
| Interquartile Range (IQR) | 5.4% | 3.3% |
| Standard Deviation (Sample) | 5.2% | 3.1% |
| Standard Deviation (Population) | 5.1% | 3.1% |
Similar Demographics by 10th Grade
Demographics Similar to Immigrants from Nicaragua by 10th Grade
In terms of 10th grade, the demographic groups most similar to Immigrants from Nicaragua are Immigrants from Cabo Verde (89.5%, a difference of 0.010%), Dominican (89.4%, a difference of 0.11%), Central American Indian (89.7%, a difference of 0.26%), Puerto Rican (89.8%, a difference of 0.43%), and Immigrants from Armenia (89.9%, a difference of 0.46%).
| Demographics | Rating | Rank | 10th Grade |
| Houma | 0.0 /100 | #320 | Tragic 90.2% |
| Belizeans | 0.0 /100 | #321 | Tragic 90.2% |
| Tohono O'odham | 0.0 /100 | #322 | Tragic 90.1% |
| Immigrants | Belize | 0.0 /100 | #323 | Tragic 90.1% |
| Immigrants | Armenia | 0.0 /100 | #324 | Tragic 89.9% |
| Puerto Ricans | 0.0 /100 | #325 | Tragic 89.8% |
| Central American Indians | 0.0 /100 | #326 | Tragic 89.7% |
| Immigrants | Nicaragua | 0.0 /100 | #327 | Tragic 89.5% |
| Immigrants | Cabo Verde | 0.0 /100 | #328 | Tragic 89.5% |
| Dominicans | 0.0 /100 | #329 | Tragic 89.4% |
| Immigrants | Yemen | 0.0 /100 | #330 | Tragic 89.1% |
| Mexican American Indians | 0.0 /100 | #331 | Tragic 89.0% |
| Immigrants | Azores | 0.0 /100 | #332 | Tragic 89.0% |
| Hondurans | 0.0 /100 | #333 | Tragic 89.0% |
| Hispanics or Latinos | 0.0 /100 | #334 | Tragic 88.9% |
Demographics Similar to Scandinavians by 10th Grade
In terms of 10th grade, the demographic groups most similar to Scandinavians are Italian (95.6%, a difference of 0.0%), Latvian (95.6%, a difference of 0.010%), Scottish (95.6%, a difference of 0.020%), Chinese (95.5%, a difference of 0.020%), and Dutch (95.5%, a difference of 0.030%).
| Demographics | Rating | Rank | 10th Grade |
| Tlingit-Haida | 100.0 /100 | #12 | Exceptional 95.7% |
| English | 100.0 /100 | #13 | Exceptional 95.6% |
| Tsimshian | 100.0 /100 | #14 | Exceptional 95.6% |
| Irish | 100.0 /100 | #15 | Exceptional 95.6% |
| Scottish | 100.0 /100 | #16 | Exceptional 95.6% |
| Latvians | 100.0 /100 | #17 | Exceptional 95.6% |
| Italians | 100.0 /100 | #18 | Exceptional 95.6% |
| Scandinavians | 100.0 /100 | #19 | Exceptional 95.6% |
| Chinese | 100.0 /100 | #20 | Exceptional 95.5% |
| Dutch | 100.0 /100 | #21 | Exceptional 95.5% |
| Eastern Europeans | 100.0 /100 | #22 | Exceptional 95.5% |
| Czechs | 100.0 /100 | #23 | Exceptional 95.5% |
| Europeans | 100.0 /100 | #24 | Exceptional 95.5% |
| Maltese | 100.0 /100 | #25 | Exceptional 95.5% |
| Welsh | 100.0 /100 | #26 | Exceptional 95.5% |