Immigrants from Nicaragua vs Immigrants from Uzbekistan No Schooling Completed
COMPARE
Immigrants from Nicaragua
Immigrants from Uzbekistan
No Schooling Completed
No Schooling Completed Comparison
Immigrants from Nicaragua
Immigrants from Uzbekistan
3.1%
NO SCHOOLING COMPLETED
0.0/ 100
METRIC RATING
315th/ 347
METRIC RANK
2.6%
NO SCHOOLING COMPLETED
0.1/ 100
METRIC RATING
278th/ 347
METRIC RANK
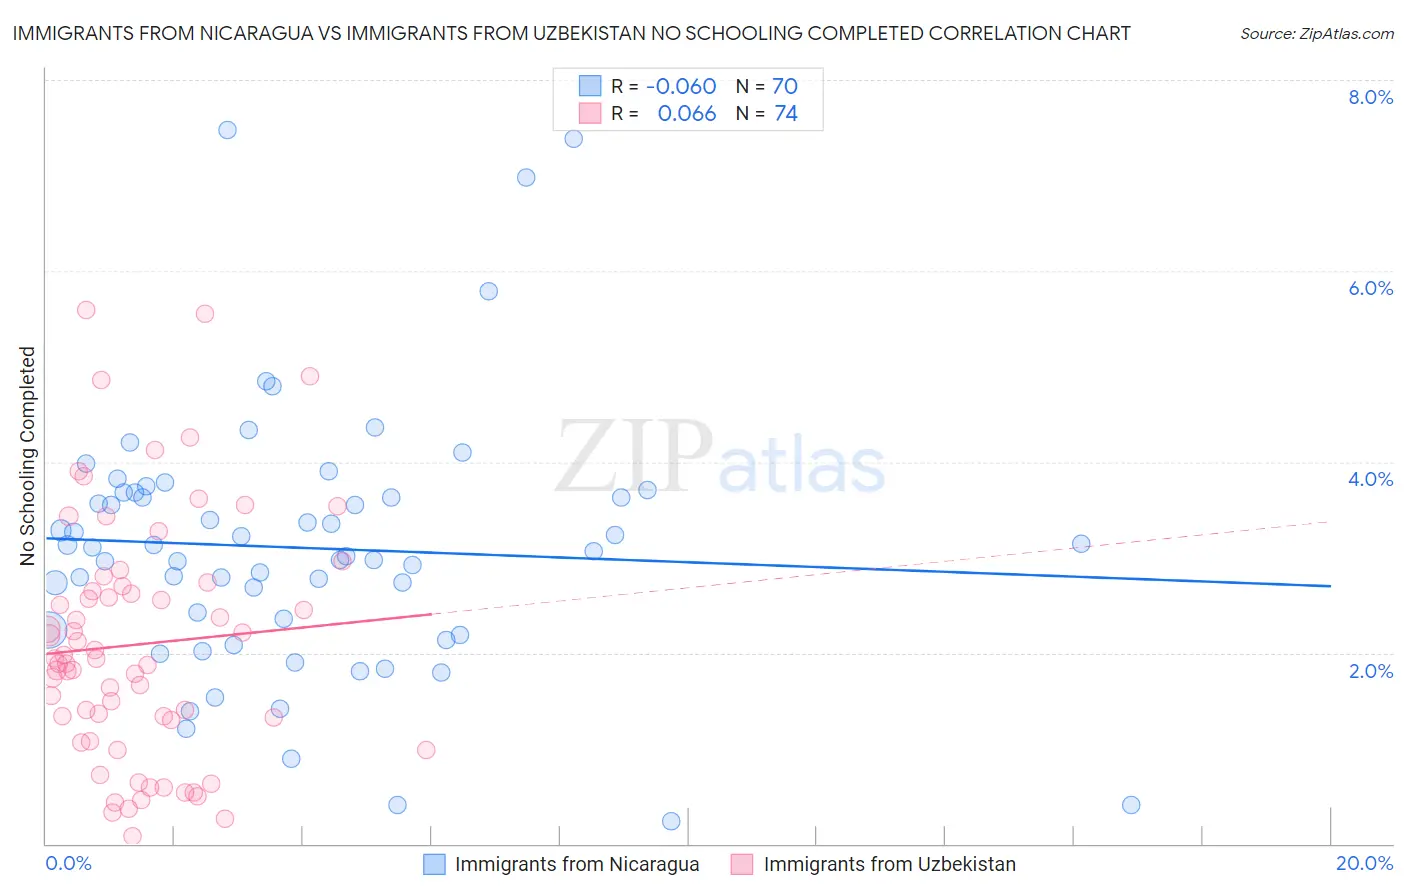
Immigrants from Nicaragua vs Immigrants from Uzbekistan No Schooling Completed Correlation Chart
The statistical analysis conducted on geographies consisting of 235,758,389 people shows a slight negative correlation between the proportion of Immigrants from Nicaragua and percentage of population with no schooling in the United States with a correlation coefficient (R) of -0.060 and weighted average of 3.1%. Similarly, the statistical analysis conducted on geographies consisting of 118,288,407 people shows a slight positive correlation between the proportion of Immigrants from Uzbekistan and percentage of population with no schooling in the United States with a correlation coefficient (R) of 0.066 and weighted average of 2.6%, a difference of 19.0%.
No Schooling Completed Correlation Summary
| Measurement | Immigrants from Nicaragua | Immigrants from Uzbekistan |
| Minimum | 0.23% | 0.076% |
| Maximum | 7.5% | 5.6% |
| Range | 7.2% | 5.5% |
| Mean | 3.1% | 2.1% |
| Median | 3.1% | 1.9% |
| Interquartile 25% (IQ1) | 2.2% | 1.3% |
| Interquartile 75% (IQ3) | 3.7% | 2.7% |
| Interquartile Range (IQR) | 1.4% | 1.4% |
| Standard Deviation (Sample) | 1.4% | 1.3% |
| Standard Deviation (Population) | 1.4% | 1.3% |
Similar Demographics by No Schooling Completed
Demographics Similar to Immigrants from Nicaragua by No Schooling Completed
In terms of no schooling completed, the demographic groups most similar to Immigrants from Nicaragua are Immigrants from Belize (3.1%, a difference of 0.24%), Honduran (3.1%, a difference of 0.33%), Immigrants from Ecuador (3.1%, a difference of 0.36%), Sri Lankan (3.0%, a difference of 0.84%), and Cape Verdean (3.1%, a difference of 0.84%).
| Demographics | Rating | Rank | No Schooling Completed |
| Immigrants | Somalia | 0.0 /100 | #308 | Tragic 3.0% |
| Hispanics or Latinos | 0.0 /100 | #309 | Tragic 3.0% |
| Guyanese | 0.0 /100 | #310 | Tragic 3.0% |
| Immigrants | Azores | 0.0 /100 | #311 | Tragic 3.0% |
| Sri Lankans | 0.0 /100 | #312 | Tragic 3.0% |
| Hondurans | 0.0 /100 | #313 | Tragic 3.1% |
| Immigrants | Belize | 0.0 /100 | #314 | Tragic 3.1% |
| Immigrants | Nicaragua | 0.0 /100 | #315 | Tragic 3.1% |
| Immigrants | Ecuador | 0.0 /100 | #316 | Tragic 3.1% |
| Cape Verdeans | 0.0 /100 | #317 | Tragic 3.1% |
| Immigrants | Guyana | 0.0 /100 | #318 | Tragic 3.1% |
| Immigrants | Burma/Myanmar | 0.0 /100 | #319 | Tragic 3.1% |
| Immigrants | Bangladesh | 0.0 /100 | #320 | Tragic 3.1% |
| Immigrants | Laos | 0.0 /100 | #321 | Tragic 3.1% |
| Immigrants | Honduras | 0.0 /100 | #322 | Tragic 3.2% |
Demographics Similar to Immigrants from Uzbekistan by No Schooling Completed
In terms of no schooling completed, the demographic groups most similar to Immigrants from Uzbekistan are Immigrants from Philippines (2.6%, a difference of 0.20%), Immigrants from Western Africa (2.6%, a difference of 0.25%), Barbadian (2.6%, a difference of 0.55%), Trinidadian and Tobagonian (2.6%, a difference of 0.56%), and Afghan (2.6%, a difference of 0.64%).
| Demographics | Rating | Rank | No Schooling Completed |
| Cubans | 0.2 /100 | #271 | Tragic 2.5% |
| Immigrants | Bolivia | 0.2 /100 | #272 | Tragic 2.5% |
| Immigrants | Cameroon | 0.1 /100 | #273 | Tragic 2.5% |
| Ghanaians | 0.1 /100 | #274 | Tragic 2.6% |
| Immigrants | China | 0.1 /100 | #275 | Tragic 2.6% |
| Immigrants | Western Africa | 0.1 /100 | #276 | Tragic 2.6% |
| Immigrants | Philippines | 0.1 /100 | #277 | Tragic 2.6% |
| Immigrants | Uzbekistan | 0.1 /100 | #278 | Tragic 2.6% |
| Barbadians | 0.1 /100 | #279 | Tragic 2.6% |
| Trinidadians and Tobagonians | 0.1 /100 | #280 | Tragic 2.6% |
| Afghans | 0.1 /100 | #281 | Tragic 2.6% |
| Immigrants | Ghana | 0.1 /100 | #282 | Tragic 2.6% |
| Immigrants | Trinidad and Tobago | 0.0 /100 | #283 | Tragic 2.6% |
| Immigrants | West Indies | 0.0 /100 | #284 | Tragic 2.7% |
| Immigrants | Barbados | 0.0 /100 | #285 | Tragic 2.7% |