Immigrants from Nicaragua vs Canadian Associate's Degree
COMPARE
Immigrants from Nicaragua
Canadian
Associate's Degree
Associate's Degree Comparison
Immigrants from Nicaragua
Canadians
40.3%
ASSOCIATE'S DEGREE
0.1/ 100
METRIC RATING
279th/ 347
METRIC RANK
47.5%
ASSOCIATE'S DEGREE
79.0/ 100
METRIC RATING
145th/ 347
METRIC RANK
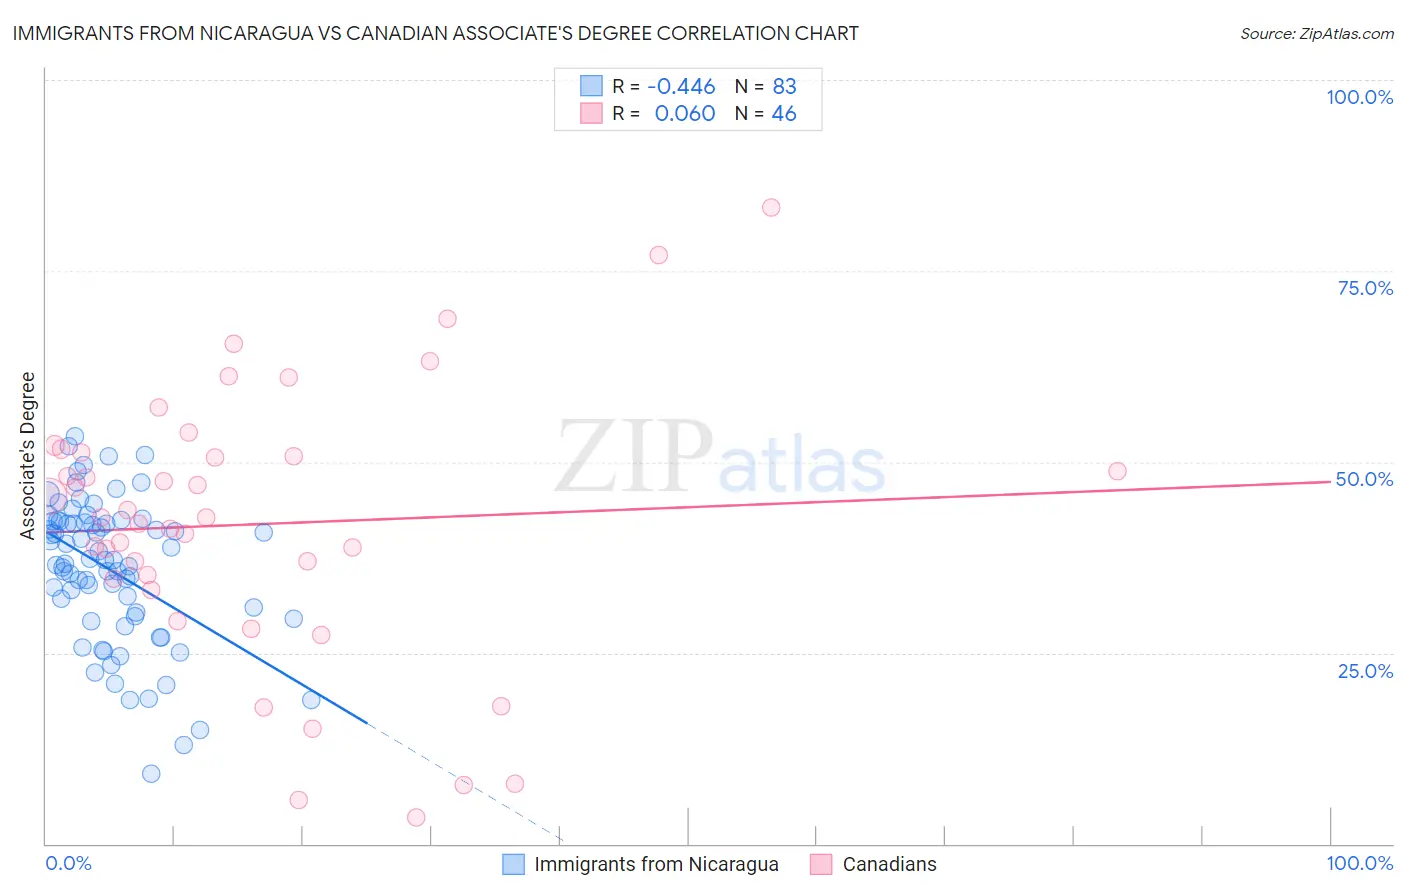
Immigrants from Nicaragua vs Canadian Associate's Degree Correlation Chart
The statistical analysis conducted on geographies consisting of 236,338,316 people shows a moderate negative correlation between the proportion of Immigrants from Nicaragua and percentage of population with at least associate's degree education in the United States with a correlation coefficient (R) of -0.446 and weighted average of 40.3%. Similarly, the statistical analysis conducted on geographies consisting of 437,535,848 people shows a slight positive correlation between the proportion of Canadians and percentage of population with at least associate's degree education in the United States with a correlation coefficient (R) of 0.060 and weighted average of 47.5%, a difference of 18.0%.
Associate's Degree Correlation Summary
| Measurement | Immigrants from Nicaragua | Canadian |
| Minimum | 9.1% | 3.4% |
| Maximum | 53.3% | 83.3% |
| Range | 44.2% | 80.0% |
| Mean | 35.9% | 41.8% |
| Median | 37.1% | 42.7% |
| Interquartile 25% (IQ1) | 29.7% | 34.7% |
| Interquartile 75% (IQ3) | 42.2% | 51.3% |
| Interquartile Range (IQR) | 12.4% | 16.6% |
| Standard Deviation (Sample) | 9.4% | 17.8% |
| Standard Deviation (Population) | 9.3% | 17.6% |
Similar Demographics by Associate's Degree
Demographics Similar to Immigrants from Nicaragua by Associate's Degree
In terms of associate's degree, the demographic groups most similar to Immigrants from Nicaragua are Ottawa (40.3%, a difference of 0.040%), Blackfeet (40.3%, a difference of 0.19%), Immigrants from Micronesia (40.2%, a difference of 0.20%), Puerto Rican (40.4%, a difference of 0.24%), and Immigrants from Portugal (40.1%, a difference of 0.30%).
| Demographics | Rating | Rank | Associate's Degree |
| Belizeans | 0.1 /100 | #272 | Tragic 40.6% |
| Puget Sound Salish | 0.1 /100 | #273 | Tragic 40.5% |
| Immigrants | Dominica | 0.1 /100 | #274 | Tragic 40.5% |
| Potawatomi | 0.1 /100 | #275 | Tragic 40.4% |
| Puerto Ricans | 0.1 /100 | #276 | Tragic 40.4% |
| Blackfeet | 0.1 /100 | #277 | Tragic 40.3% |
| Ottawa | 0.1 /100 | #278 | Tragic 40.3% |
| Immigrants | Nicaragua | 0.1 /100 | #279 | Tragic 40.3% |
| Immigrants | Micronesia | 0.1 /100 | #280 | Tragic 40.2% |
| Immigrants | Portugal | 0.1 /100 | #281 | Tragic 40.1% |
| Bangladeshis | 0.1 /100 | #282 | Tragic 40.0% |
| Haitians | 0.1 /100 | #283 | Tragic 40.0% |
| Comanche | 0.1 /100 | #284 | Tragic 39.9% |
| Immigrants | Belize | 0.1 /100 | #285 | Tragic 39.9% |
| Immigrants | Caribbean | 0.0 /100 | #286 | Tragic 39.7% |
Demographics Similar to Canadians by Associate's Degree
In terms of associate's degree, the demographic groups most similar to Canadians are Immigrants from Sudan (47.4%, a difference of 0.13%), Slavic (47.6%, a difference of 0.17%), Danish (47.4%, a difference of 0.18%), Norwegian (47.6%, a difference of 0.23%), and South American Indian (47.4%, a difference of 0.24%).
| Demographics | Rating | Rank | Associate's Degree |
| Poles | 87.3 /100 | #138 | Excellent 48.0% |
| Slovenes | 85.1 /100 | #139 | Excellent 47.9% |
| Immigrants | Southern Europe | 84.4 /100 | #140 | Excellent 47.8% |
| Taiwanese | 83.3 /100 | #141 | Excellent 47.7% |
| Sierra Leoneans | 82.9 /100 | #142 | Excellent 47.7% |
| Norwegians | 81.0 /100 | #143 | Excellent 47.6% |
| Slavs | 80.5 /100 | #144 | Excellent 47.6% |
| Canadians | 79.0 /100 | #145 | Good 47.5% |
| Immigrants | Sudan | 77.9 /100 | #146 | Good 47.4% |
| Danes | 77.3 /100 | #147 | Good 47.4% |
| South American Indians | 76.7 /100 | #148 | Good 47.4% |
| Immigrants | Armenia | 76.6 /100 | #149 | Good 47.4% |
| Iraqis | 76.2 /100 | #150 | Good 47.4% |
| Immigrants | North Macedonia | 76.0 /100 | #151 | Good 47.4% |
| Immigrants | Afghanistan | 74.3 /100 | #152 | Good 47.3% |