Immigrants from Netherlands vs Palestinian Professional Degree
COMPARE
Immigrants from Netherlands
Palestinian
Professional Degree
Professional Degree Comparison
Immigrants from Netherlands
Palestinians
5.8%
PROFESSIONAL DEGREE
100.0/ 100
METRIC RATING
53rd/ 347
METRIC RANK
4.8%
PROFESSIONAL DEGREE
91.5/ 100
METRIC RATING
129th/ 347
METRIC RANK
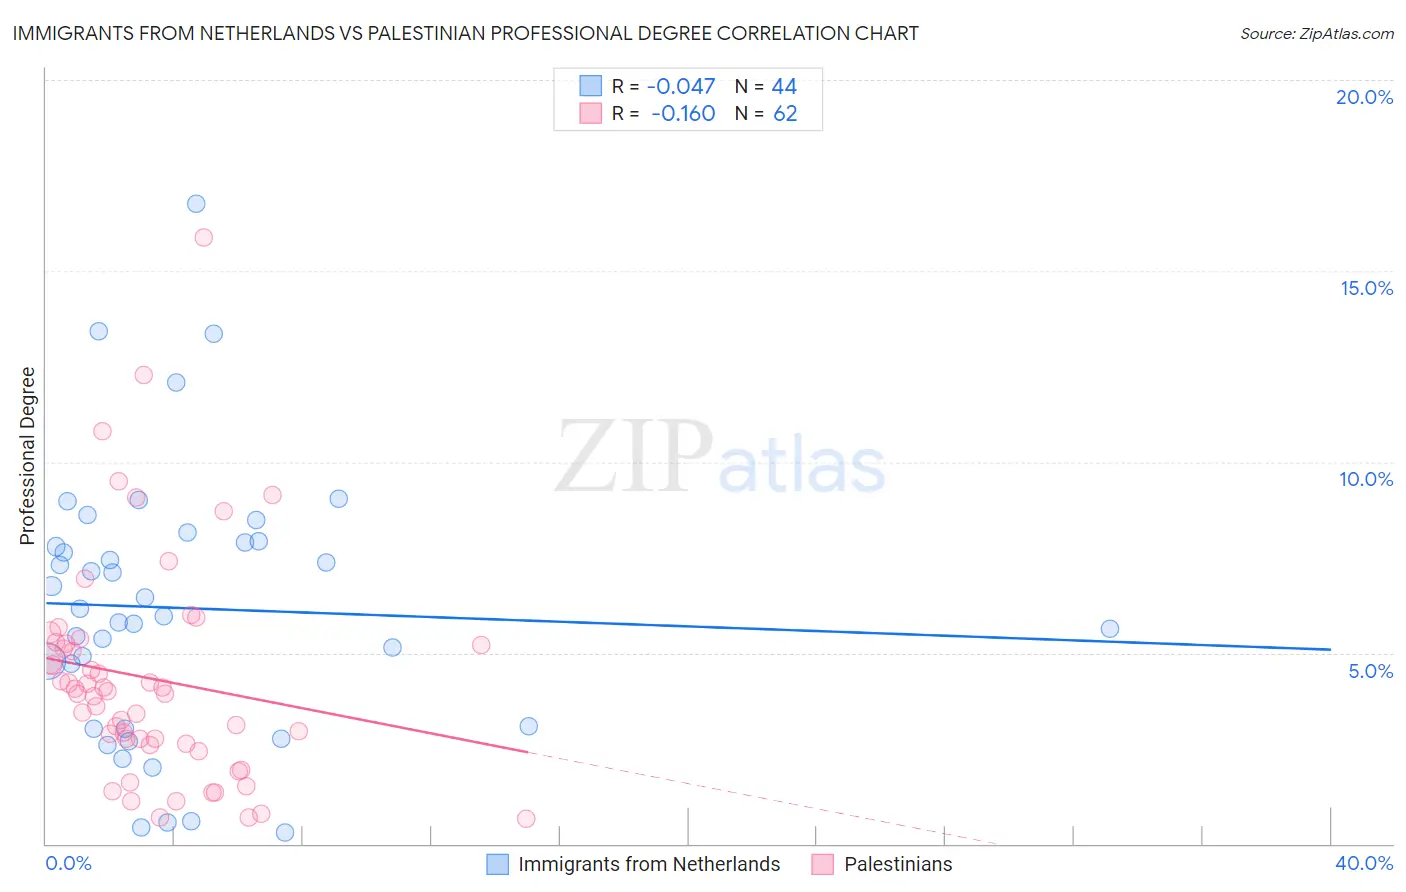
Immigrants from Netherlands vs Palestinian Professional Degree Correlation Chart
The statistical analysis conducted on geographies consisting of 237,680,329 people shows no correlation between the proportion of Immigrants from Netherlands and percentage of population with at least professional degree education in the United States with a correlation coefficient (R) of -0.047 and weighted average of 5.8%. Similarly, the statistical analysis conducted on geographies consisting of 216,348,582 people shows a poor negative correlation between the proportion of Palestinians and percentage of population with at least professional degree education in the United States with a correlation coefficient (R) of -0.160 and weighted average of 4.8%, a difference of 21.1%.
Professional Degree Correlation Summary
| Measurement | Immigrants from Netherlands | Palestinian |
| Minimum | 0.31% | 0.66% |
| Maximum | 16.8% | 15.9% |
| Range | 16.4% | 15.2% |
| Mean | 6.2% | 4.3% |
| Median | 6.1% | 4.0% |
| Interquartile 25% (IQ1) | 3.1% | 2.6% |
| Interquartile 75% (IQ3) | 7.9% | 5.2% |
| Interquartile Range (IQR) | 4.8% | 2.6% |
| Standard Deviation (Sample) | 3.6% | 2.9% |
| Standard Deviation (Population) | 3.5% | 2.9% |
Similar Demographics by Professional Degree
Demographics Similar to Immigrants from Netherlands by Professional Degree
In terms of professional degree, the demographic groups most similar to Immigrants from Netherlands are Immigrants from Serbia (5.8%, a difference of 0.23%), Immigrants from Greece (5.8%, a difference of 0.30%), Immigrants from Czechoslovakia (5.8%, a difference of 0.36%), Immigrants from Latvia (5.8%, a difference of 0.68%), and Immigrants from Kuwait (5.7%, a difference of 1.0%).
| Demographics | Rating | Rank | Professional Degree |
| Immigrants | Argentina | 100.0 /100 | #46 | Exceptional 5.9% |
| Australians | 100.0 /100 | #47 | Exceptional 5.9% |
| Paraguayans | 100.0 /100 | #48 | Exceptional 5.9% |
| Immigrants | Latvia | 100.0 /100 | #49 | Exceptional 5.8% |
| Immigrants | Czechoslovakia | 100.0 /100 | #50 | Exceptional 5.8% |
| Immigrants | Greece | 100.0 /100 | #51 | Exceptional 5.8% |
| Immigrants | Serbia | 100.0 /100 | #52 | Exceptional 5.8% |
| Immigrants | Netherlands | 100.0 /100 | #53 | Exceptional 5.8% |
| Immigrants | Kuwait | 100.0 /100 | #54 | Exceptional 5.7% |
| Immigrants | Western Europe | 100.0 /100 | #55 | Exceptional 5.7% |
| Immigrants | Malaysia | 100.0 /100 | #56 | Exceptional 5.7% |
| South Africans | 100.0 /100 | #57 | Exceptional 5.7% |
| Bulgarians | 100.0 /100 | #58 | Exceptional 5.7% |
| Immigrants | Europe | 100.0 /100 | #59 | Exceptional 5.6% |
| Bolivians | 99.9 /100 | #60 | Exceptional 5.6% |
Demographics Similar to Palestinians by Professional Degree
In terms of professional degree, the demographic groups most similar to Palestinians are Icelander (4.8%, a difference of 0.030%), Immigrants from Nepal (4.8%, a difference of 0.050%), Pakistani (4.8%, a difference of 0.27%), Immigrants from Eastern Africa (4.8%, a difference of 0.46%), and Serbian (4.8%, a difference of 0.48%).
| Demographics | Rating | Rank | Professional Degree |
| Immigrants | Germany | 94.1 /100 | #122 | Exceptional 4.9% |
| Immigrants | Venezuela | 93.8 /100 | #123 | Exceptional 4.8% |
| Immigrants | Eritrea | 93.5 /100 | #124 | Exceptional 4.8% |
| Immigrants | Albania | 93.3 /100 | #125 | Exceptional 4.8% |
| Europeans | 93.2 /100 | #126 | Exceptional 4.8% |
| Serbians | 92.6 /100 | #127 | Exceptional 4.8% |
| Immigrants | Eastern Africa | 92.5 /100 | #128 | Exceptional 4.8% |
| Palestinians | 91.5 /100 | #129 | Exceptional 4.8% |
| Icelanders | 91.5 /100 | #130 | Exceptional 4.8% |
| Immigrants | Nepal | 91.4 /100 | #131 | Exceptional 4.8% |
| Pakistanis | 90.9 /100 | #132 | Exceptional 4.8% |
| Italians | 90.2 /100 | #133 | Exceptional 4.8% |
| South American Indians | 89.9 /100 | #134 | Excellent 4.8% |
| Macedonians | 89.8 /100 | #135 | Excellent 4.8% |
| Immigrants | Jordan | 89.0 /100 | #136 | Excellent 4.7% |