Immigrants from Netherlands vs Paiute 9th Grade

COMPARE

Immigrants from Netherlands
Race
Ancestry
AfghanAfricanAlaska NativeAlaskan AthabascanAlbanianAleutAlsatianAmericanApacheArabArapahoArgentineanArmenianAssyrian/Chaldean/SyriacAustralianAustrianBahamianBangladeshiBarbadianBasqueBelgianBelizeanBermudanBhutaneseBlackfeetBolivianBrazilianBritishBritish West IndianBulgarianBurmeseCajunCambodianCanadianCape VerdeanCarpatho RusynCelticCentral AmericanCentral American IndianCherokeeCheyenneChickasawChileanChineseChippewaChoctawColombianColvilleComancheCosta RicanCreeCreekCroatianCrowCubanCypriotCzechCzechoslovakianDanishDelawareDominicanDutchDutch West IndianEastern EuropeanEcuadorianEgyptianEnglishEstonianEthiopianEuropeanFijianFilipinoFinnishFrenchFrench American IndianFrench CanadianGermanGerman RussianGhanaianGreekGuamanian/ChamorroGuatemalanGuyaneseHaitianHmongHonduranHopiHoumaHungarianIcelanderIndian (Asian)IndonesianInupiatIranianIraqiIrishIroquoisIsraeliItalianJamaicanJapaneseJordanianKenyanKiowaKoreanLaotianLatvianLebaneseLiberianLithuanianLumbeeLuxembourgerMacedonianMalaysianMalteseMarshalleseMenomineeMexicanMexican American IndianMongolianMoroccanNative HawaiianNavajoNepaleseNew ZealanderNicaraguanNigerianNorthern EuropeanNorwegianOkinawanOsageOttawaPakistaniPalestinianPanamanianParaguayanPennsylvania GermanPeruvianPimaPolishPortuguesePotawatomiPuebloPuerto RicanPuget Sound SalishRomanianRussianSalvadoranSamoanScandinavianScotch-IrishScottishSeminoleSenegaleseSerbianShoshoneSierra LeoneanSiouxSlavicSlovakSloveneSomaliSouth AfricanSouth AmericanSouth American IndianSoviet UnionSpaniardSpanishSpanish AmericanSpanish American IndianSri LankanSubsaharan AfricanSudaneseSwedishSwissSyrianTaiwaneseThaiTlingit-HaidaTohono O'OdhamTonganTrinidadian and TobagonianTsimshianTurkishU.S. Virgin IslanderUgandanUkrainianUruguayanUteVenezuelanVietnameseWelshWest IndianYakamaYaquiYugoslavianYumanYup'ikZimbabwean
Immigration
NonimmigrantsImmigrantsAfghanistanAfricaAlbaniaArgentinaArmeniaAsiaAustraliaAustriaBahamasBangladeshBarbadosBelarusBelgiumBelizeBoliviaBosnia and HerzegovinaBrazilBulgariaBurma/MyanmarCabo VerdeCambodiaCameroonCanadaCaribbeanCentral AmericaChileChinaColombiaCongoCosta RicaCroatiaCubaCzechoslovakiaDenmarkDominicaDominican RepublicEastern AfricaEastern AsiaEastern EuropeEcuadorEgyptEl SalvadorEnglandEritreaEthiopiaEuropeFijiFranceGermanyGhanaGreeceGrenadaGuatemalaGuyanaHaitiHondurasHong KongHungaryIndiaIndonesiaIranIraqIrelandIsraelItalyJamaicaJapanJordanKazakhstanKenyaKoreaKuwaitLaosLatin AmericaLatviaLebanonLiberiaLithuaniaMalaysiaMexicoMicronesiaMiddle AfricaMoldovaMoroccoNepalNetherlandsNicaraguaNigeriaNorth AmericaNorth MacedoniaNorthern AfricaNorthern EuropeNorwayOceaniaPakistanPanamaPeruPhilippinesPolandPortugalRomaniaRussiaSaudi ArabiaScotlandSenegalSerbiaSierra LeoneSingaporeSomaliaSouth AfricaSouth AmericaSouth Central AsiaSouth Eastern AsiaSouthern EuropeSpainSri LankaSt. Vincent and the GrenadinesSudanSwedenSwitzerlandSyriaTaiwanThailandTrinidad and TobagoTurkeyUgandaUkraineUruguayUzbekistanVenezuelaVietnamWest IndiesWestern AfricaWestern AsiaWestern EuropeYemenZaireZimbabweAzores
Paiute
Race
Ancestry
AfghanAfricanAlaska NativeAlaskan AthabascanAlbanianAleutAlsatianAmericanApacheArabArapahoArgentineanArmenianAssyrian/Chaldean/SyriacAustralianAustrianBahamianBangladeshiBarbadianBasqueBelgianBelizeanBermudanBhutaneseBlackfeetBolivianBrazilianBritishBritish West IndianBulgarianBurmeseCajunCambodianCanadianCape VerdeanCarpatho RusynCelticCentral AmericanCentral American IndianCherokeeCheyenneChickasawChileanChineseChippewaChoctawColombianColvilleComancheCosta RicanCreeCreekCroatianCrowCubanCypriotCzechCzechoslovakianDanishDelawareDominicanDutchDutch West IndianEastern EuropeanEcuadorianEgyptianEnglishEstonianEthiopianEuropeanFijianFilipinoFinnishFrenchFrench American IndianFrench CanadianGermanGerman RussianGhanaianGreekGuamanian/ChamorroGuatemalanGuyaneseHaitianHmongHonduranHopiHoumaHungarianIcelanderIndian (Asian)IndonesianInupiatIranianIraqiIrishIroquoisIsraeliItalianJamaicanJapaneseJordanianKenyanKiowaKoreanLaotianLatvianLebaneseLiberianLithuanianLumbeeLuxembourgerMacedonianMalaysianMalteseMarshalleseMenomineeMexicanMexican American IndianMongolianMoroccanNative HawaiianNavajoNepaleseNew ZealanderNicaraguanNigerianNorthern EuropeanNorwegianOkinawanOsageOttawaPaiutePakistaniPalestinianPanamanianParaguayanPennsylvania GermanPeruvianPimaPolishPortuguesePotawatomiPuebloPuerto RicanPuget Sound SalishRomanianRussianSalvadoranSamoanScandinavianScotch-IrishScottishSeminoleSenegaleseSerbianShoshoneSierra LeoneanSiouxSlavicSlovakSloveneSomaliSouth AfricanSouth AmericanSouth American IndianSoviet UnionSpaniardSpanishSpanish AmericanSpanish American IndianSri LankanSubsaharan AfricanSudaneseSwedishSwissSyrianTaiwaneseThaiTlingit-HaidaTohono O'OdhamTonganTrinidadian and TobagonianTsimshianTurkishU.S. Virgin IslanderUgandanUkrainianUruguayanUteVenezuelanVietnameseWelshWest IndianYakamaYaquiYugoslavianYumanYup'ikZimbabwean
Immigration
NonimmigrantsImmigrantsAfghanistanAfricaAlbaniaArgentinaArmeniaAsiaAustraliaAustriaBahamasBangladeshBarbadosBelarusBelgiumBelizeBoliviaBosnia and HerzegovinaBrazilBulgariaBurma/MyanmarCabo VerdeCambodiaCameroonCanadaCaribbeanCentral AmericaChileChinaColombiaCongoCosta RicaCroatiaCubaCzechoslovakiaDenmarkDominicaDominican RepublicEastern AfricaEastern AsiaEastern EuropeEcuadorEgyptEl SalvadorEnglandEritreaEthiopiaEuropeFijiFranceGermanyGhanaGreeceGrenadaGuatemalaGuyanaHaitiHondurasHong KongHungaryIndiaIndonesiaIranIraqIrelandIsraelItalyJamaicaJapanJordanKazakhstanKenyaKoreaKuwaitLaosLatin AmericaLatviaLebanonLiberiaLithuaniaMalaysiaMexicoMicronesiaMiddle AfricaMoldovaMoroccoNepalNicaraguaNigeriaNorth AmericaNorth MacedoniaNorthern AfricaNorthern EuropeNorwayOceaniaPakistanPanamaPeruPhilippinesPolandPortugalRomaniaRussiaSaudi ArabiaScotlandSenegalSerbiaSierra LeoneSingaporeSomaliaSouth AfricaSouth AmericaSouth Central AsiaSouth Eastern AsiaSouthern EuropeSpainSri LankaSt. Vincent and the GrenadinesSudanSwedenSwitzerlandSyriaTaiwanThailandTrinidad and TobagoTurkeyUgandaUkraineUruguayUzbekistanVenezuelaVietnamWest IndiesWestern AfricaWestern AsiaWestern EuropeYemenZaireZimbabweAzores
9th Grade
Income
Poverty
Unemployment
Labor Participation
Family Structure
Vehicle Availability
Education Level
Disability

9th Grade Comparison

Immigrants from Netherlands

Paiute

Exceptional
Tragic
95.8%
9TH GRADE
99.6/ 100
METRIC RATING
66th/ 347
METRIC RANK
94.2%
9TH GRADE
1.9/ 100
METRIC RATING
245th/ 347
METRIC RANK

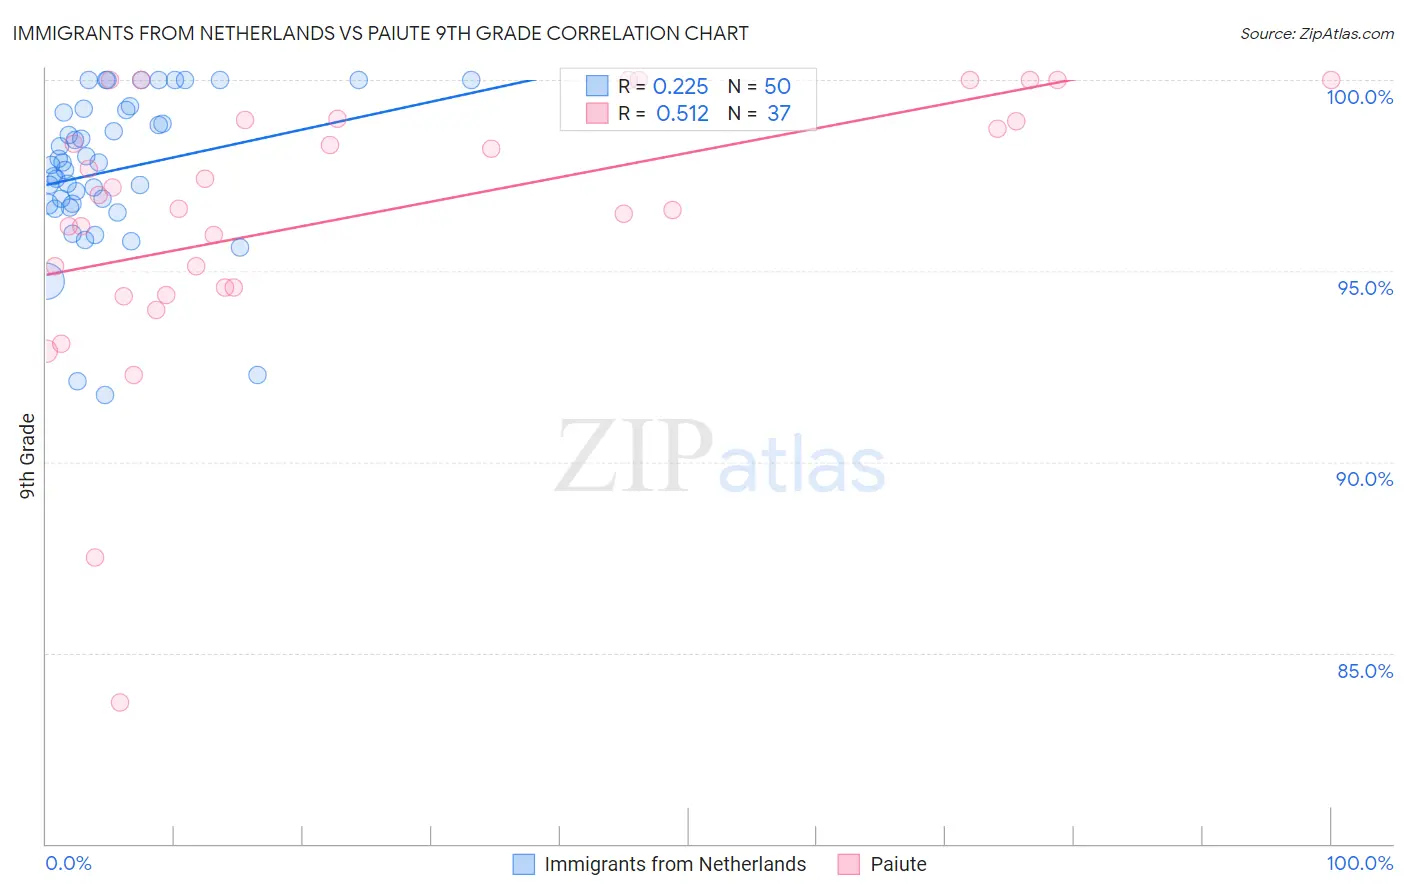
Immigrants from Netherlands vs Paiute 9th Grade Correlation Chart

The statistical analysis conducted on geographies consisting of 237,869,934 people shows a weak positive correlation between the proportion of Immigrants from Netherlands and percentage of population with at least 9th grade education in the United States with a correlation coefficient (R) of 0.225 and weighted average of 95.8%. Similarly, the statistical analysis conducted on geographies consisting of 58,403,520 people shows a substantial positive correlation between the proportion of Paiute and percentage of population with at least 9th grade education in the United States with a correlation coefficient (R) of 0.512 and weighted average of 94.2%, a difference of 1.8%.
Immigrants from Netherlands vs Paiute 9th Grade

9th Grade Correlation Summary

MeasurementImmigrants from NetherlandsPaiute
Minimum91.8%83.7%
Maximum100.0%100.0%
Range8.2%16.3%
Mean97.6%96.5%
Median97.8%97.0%
Interquartile 25% (IQ1)96.7%94.6%
Interquartile 75% (IQ3)99.2%99.0%
Interquartile Range (IQR)2.5%4.4%
Standard Deviation (Sample)2.0%3.5%
Standard Deviation (Population)2.0%3.5%

Similar Demographics by 9th Grade

Demographics Similar to Immigrants from Netherlands by 9th Grade

In terms of 9th grade, the demographic groups most similar to Immigrants from Netherlands are Cypriot (95.8%, a difference of 0.010%), Immigrants from Ireland (95.8%, a difference of 0.010%), Immigrants from Lithuania (95.8%, a difference of 0.010%), Immigrants from England (95.9%, a difference of 0.020%), and Zimbabwean (95.9%, a difference of 0.030%).
DemographicsRating | Rank9th Grade
New Zealanders
99.8
/100
|
#59
Exceptional
95.9%
Native Hawaiians
99.8
/100
|
#60
Exceptional
95.9%
Sioux
99.8
/100
|
#61
Exceptional
95.9%
Ukrainians
99.7
/100
|
#62
Exceptional
95.9%
Canadians
99.7
/100
|
#63
Exceptional
95.9%
Zimbabweans
99.7
/100
|
#64
Exceptional
95.9%
Immigrants | England
99.6
/100
|
#65
Exceptional
95.9%
Immigrants | Netherlands
99.6
/100
|
#66
Exceptional
95.8%
Cypriots
99.6
/100
|
#67
Exceptional
95.8%
Immigrants | Ireland
99.6
/100
|
#68
Exceptional
95.8%
Immigrants | Lithuania
99.6
/100
|
#69
Exceptional
95.8%
Immigrants | Australia
99.5
/100
|
#70
Exceptional
95.8%
Immigrants | Belgium
99.5
/100
|
#71
Exceptional
95.8%
Turks
99.5
/100
|
#72
Exceptional
95.8%
Immigrants | Singapore
99.5
/100
|
#73
Exceptional
95.8%

Demographics Similar to Paiute by 9th Grade

In terms of 9th grade, the demographic groups most similar to Paiute are Senegalese (94.2%, a difference of 0.0%), Dutch West Indian (94.2%, a difference of 0.010%), Afghan (94.2%, a difference of 0.010%), Immigrants from Middle Africa (94.2%, a difference of 0.020%), and Immigrants from Cameroon (94.2%, a difference of 0.020%).
DemographicsRating | Rank9th Grade
South American Indians
2.8
/100
|
#238
Tragic
94.3%
Immigrants | China
2.8
/100
|
#239
Tragic
94.3%
Immigrants | Ethiopia
2.7
/100
|
#240
Tragic
94.3%
Spanish Americans
2.6
/100
|
#241
Tragic
94.2%
Immigrants | Middle Africa
2.2
/100
|
#242
Tragic
94.2%
Immigrants | Cameroon
2.1
/100
|
#243
Tragic
94.2%
Dutch West Indians
2.0
/100
|
#244
Tragic
94.2%
Paiute
1.9
/100
|
#245
Tragic
94.2%
Senegalese
1.9
/100
|
#246
Tragic
94.2%
Afghans
1.8
/100
|
#247
Tragic
94.2%
Immigrants | Somalia
1.4
/100
|
#248
Tragic
94.1%
Uruguayans
1.3
/100
|
#249
Tragic
94.1%
Immigrants | Hong Kong
1.3
/100
|
#250
Tragic
94.1%
Jamaicans
1.0
/100
|
#251
Tragic
94.1%
Immigrants | Senegal
0.9
/100
|
#252
Tragic
94.1%