Immigrants from Netherlands vs Immigrants from Iraq 10th Grade
COMPARE
Immigrants from Netherlands
Immigrants from Iraq
10th Grade
10th Grade Comparison
Immigrants from Netherlands
Immigrants from Iraq
94.9%
10TH GRADE
99.7/ 100
METRIC RATING
67th/ 347
METRIC RANK
93.8%
10TH GRADE
63.0/ 100
METRIC RATING
166th/ 347
METRIC RANK
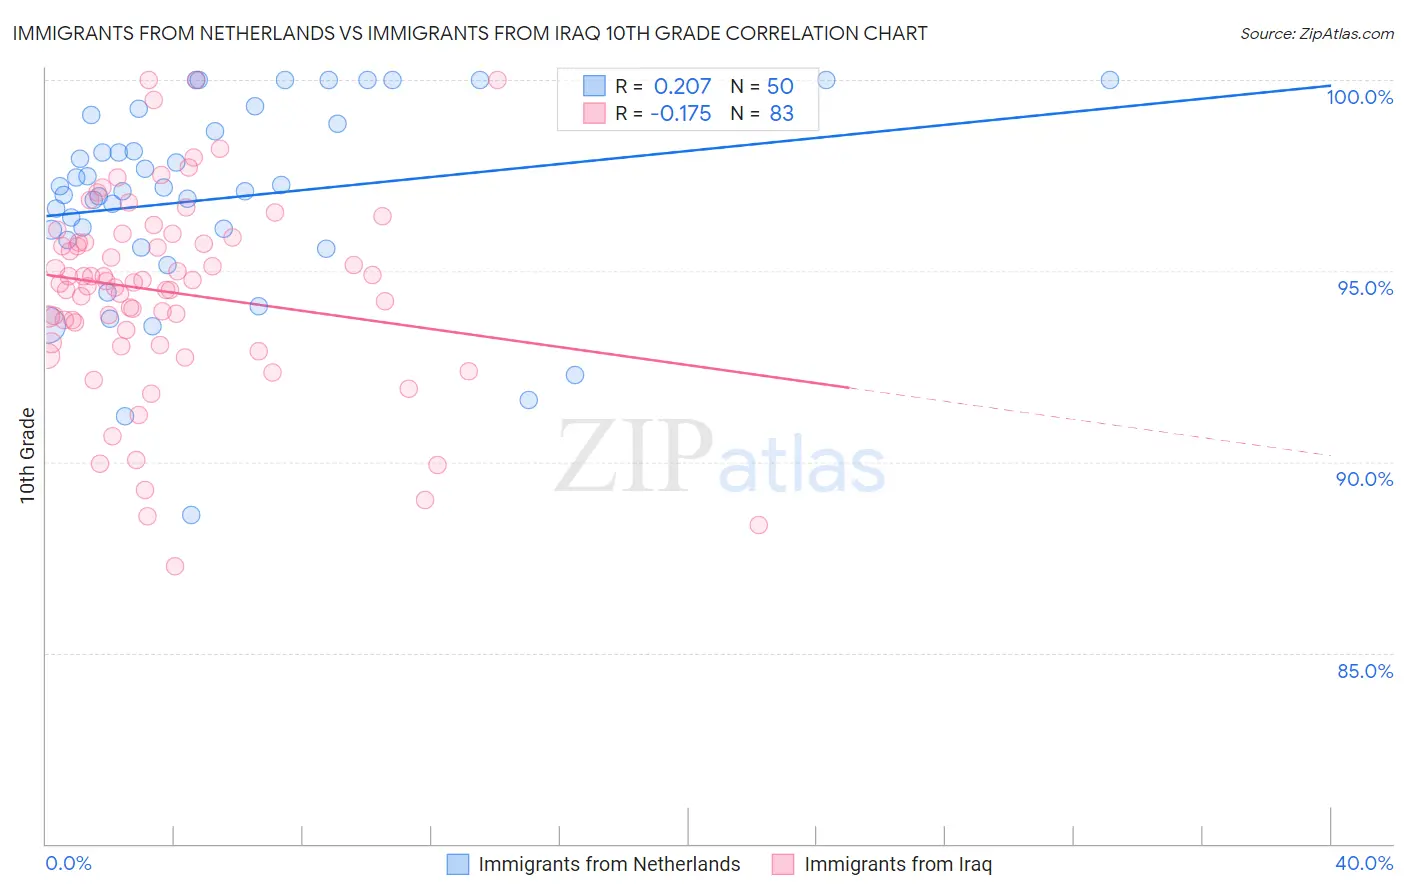
Immigrants from Netherlands vs Immigrants from Iraq 10th Grade Correlation Chart
The statistical analysis conducted on geographies consisting of 237,869,934 people shows a weak positive correlation between the proportion of Immigrants from Netherlands and percentage of population with at least 10th grade education in the United States with a correlation coefficient (R) of 0.207 and weighted average of 94.9%. Similarly, the statistical analysis conducted on geographies consisting of 194,632,332 people shows a poor negative correlation between the proportion of Immigrants from Iraq and percentage of population with at least 10th grade education in the United States with a correlation coefficient (R) of -0.175 and weighted average of 93.8%, a difference of 1.1%.
10th Grade Correlation Summary
| Measurement | Immigrants from Netherlands | Immigrants from Iraq |
| Minimum | 88.6% | 87.3% |
| Maximum | 100.0% | 100.0% |
| Range | 11.4% | 12.7% |
| Mean | 96.9% | 94.4% |
| Median | 97.1% | 94.7% |
| Interquartile 25% (IQ1) | 95.8% | 93.1% |
| Interquartile 75% (IQ3) | 98.8% | 95.9% |
| Interquartile Range (IQR) | 3.0% | 2.8% |
| Standard Deviation (Sample) | 2.6% | 2.6% |
| Standard Deviation (Population) | 2.5% | 2.6% |
Similar Demographics by 10th Grade
Demographics Similar to Immigrants from Netherlands by 10th Grade
In terms of 10th grade, the demographic groups most similar to Immigrants from Netherlands are Immigrants from Australia (94.9%, a difference of 0.0%), Immigrants from Belgium (94.9%, a difference of 0.0%), Immigrants from England (94.9%, a difference of 0.020%), Zimbabwean (94.9%, a difference of 0.030%), and Alaska Native (94.9%, a difference of 0.030%).
| Demographics | Rating | Rank | 10th Grade |
| Cypriots | 99.8 /100 | #60 | Exceptional 95.0% |
| Chippewa | 99.8 /100 | #61 | Exceptional 95.0% |
| Thais | 99.8 /100 | #62 | Exceptional 95.0% |
| Immigrants | Singapore | 99.8 /100 | #63 | Exceptional 95.0% |
| Native Hawaiians | 99.7 /100 | #64 | Exceptional 95.0% |
| Turks | 99.7 /100 | #65 | Exceptional 95.0% |
| Immigrants | Australia | 99.7 /100 | #66 | Exceptional 94.9% |
| Immigrants | Netherlands | 99.7 /100 | #67 | Exceptional 94.9% |
| Immigrants | Belgium | 99.7 /100 | #68 | Exceptional 94.9% |
| Immigrants | England | 99.6 /100 | #69 | Exceptional 94.9% |
| Zimbabweans | 99.6 /100 | #70 | Exceptional 94.9% |
| Alaska Natives | 99.6 /100 | #71 | Exceptional 94.9% |
| Immigrants | Sweden | 99.6 /100 | #72 | Exceptional 94.9% |
| Bhutanese | 99.6 /100 | #73 | Exceptional 94.9% |
| Canadians | 99.6 /100 | #74 | Exceptional 94.9% |
Demographics Similar to Immigrants from Iraq by 10th Grade
In terms of 10th grade, the demographic groups most similar to Immigrants from Iraq are Brazilian (93.8%, a difference of 0.010%), Immigrants from Egypt (93.8%, a difference of 0.010%), Alsatian (93.8%, a difference of 0.030%), Iraqi (93.9%, a difference of 0.050%), and Chilean (93.9%, a difference of 0.070%).
| Demographics | Rating | Rank | 10th Grade |
| Chileans | 70.2 /100 | #159 | Good 93.9% |
| Pakistanis | 70.1 /100 | #160 | Good 93.9% |
| Assyrians/Chaldeans/Syriacs | 69.7 /100 | #161 | Good 93.9% |
| Immigrants | Poland | 69.6 /100 | #162 | Good 93.9% |
| Venezuelans | 69.5 /100 | #163 | Good 93.9% |
| Iraqis | 68.1 /100 | #164 | Good 93.9% |
| Brazilians | 63.6 /100 | #165 | Good 93.8% |
| Immigrants | Iraq | 63.0 /100 | #166 | Good 93.8% |
| Immigrants | Egypt | 62.3 /100 | #167 | Good 93.8% |
| Alsatians | 59.4 /100 | #168 | Average 93.8% |
| Immigrants | Spain | 55.9 /100 | #169 | Average 93.8% |
| Immigrants | Venezuela | 53.9 /100 | #170 | Average 93.8% |
| Immigrants | Albania | 52.4 /100 | #171 | Average 93.8% |
| French American Indians | 50.9 /100 | #172 | Average 93.7% |
| Spaniards | 50.3 /100 | #173 | Average 93.7% |