Immigrants from Nepal vs U.S. Virgin Islander Master's Degree
COMPARE
Immigrants from Nepal
U.S. Virgin Islander
Master's Degree
Master's Degree Comparison
Immigrants from Nepal
U.S. Virgin Islanders
17.0%
MASTER'S DEGREE
98.6/ 100
METRIC RATING
101st/ 347
METRIC RANK
13.1%
MASTER'S DEGREE
2.1/ 100
METRIC RATING
241st/ 347
METRIC RANK
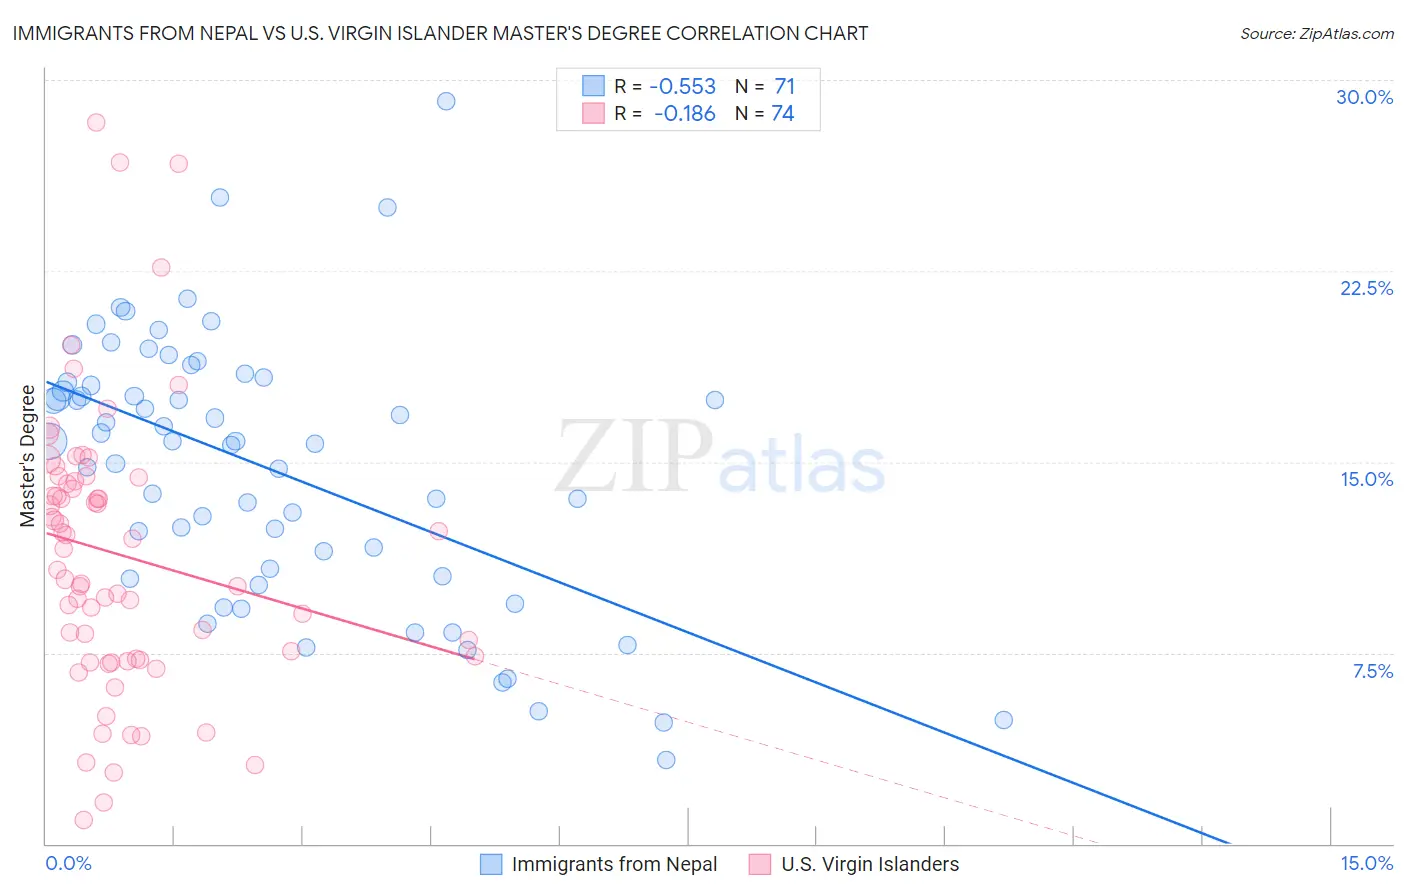
Immigrants from Nepal vs U.S. Virgin Islander Master's Degree Correlation Chart
The statistical analysis conducted on geographies consisting of 186,748,822 people shows a substantial negative correlation between the proportion of Immigrants from Nepal and percentage of population with at least master's degree education in the United States with a correlation coefficient (R) of -0.553 and weighted average of 17.0%. Similarly, the statistical analysis conducted on geographies consisting of 87,520,164 people shows a poor negative correlation between the proportion of U.S. Virgin Islanders and percentage of population with at least master's degree education in the United States with a correlation coefficient (R) of -0.186 and weighted average of 13.1%, a difference of 29.6%.
Master's Degree Correlation Summary
| Measurement | Immigrants from Nepal | U.S. Virgin Islander |
| Minimum | 3.3% | 0.93% |
| Maximum | 29.2% | 28.3% |
| Range | 25.9% | 27.4% |
| Mean | 14.7% | 11.4% |
| Median | 15.8% | 11.2% |
| Interquartile 25% (IQ1) | 10.5% | 7.2% |
| Interquartile 75% (IQ3) | 18.1% | 14.2% |
| Interquartile Range (IQR) | 7.6% | 7.0% |
| Standard Deviation (Sample) | 5.3% | 5.5% |
| Standard Deviation (Population) | 5.2% | 5.5% |
Similar Demographics by Master's Degree
Demographics Similar to Immigrants from Nepal by Master's Degree
In terms of master's degree, the demographic groups most similar to Immigrants from Nepal are Chilean (16.9%, a difference of 0.080%), Albanian (17.0%, a difference of 0.18%), Laotian (17.0%, a difference of 0.39%), Alsatian (16.9%, a difference of 0.41%), and Immigrants from Ukraine (17.0%, a difference of 0.45%).
| Demographics | Rating | Rank | Master's Degree |
| Ugandans | 99.0 /100 | #94 | Exceptional 17.1% |
| Immigrants | Morocco | 98.9 /100 | #95 | Exceptional 17.1% |
| Immigrants | Northern Africa | 98.9 /100 | #96 | Exceptional 17.1% |
| Immigrants | England | 98.8 /100 | #97 | Exceptional 17.0% |
| Immigrants | Ukraine | 98.8 /100 | #98 | Exceptional 17.0% |
| Laotians | 98.8 /100 | #99 | Exceptional 17.0% |
| Albanians | 98.7 /100 | #100 | Exceptional 17.0% |
| Immigrants | Nepal | 98.6 /100 | #101 | Exceptional 17.0% |
| Chileans | 98.6 /100 | #102 | Exceptional 16.9% |
| Alsatians | 98.4 /100 | #103 | Exceptional 16.9% |
| Ukrainians | 98.3 /100 | #104 | Exceptional 16.9% |
| Syrians | 98.3 /100 | #105 | Exceptional 16.8% |
| Immigrants | Albania | 98.1 /100 | #106 | Exceptional 16.8% |
| Armenians | 98.0 /100 | #107 | Exceptional 16.8% |
| Sierra Leoneans | 98.0 /100 | #108 | Exceptional 16.8% |
Demographics Similar to U.S. Virgin Islanders by Master's Degree
In terms of master's degree, the demographic groups most similar to U.S. Virgin Islanders are Guamanian/Chamorro (13.1%, a difference of 0.14%), Spanish American (13.0%, a difference of 0.28%), Immigrants from Jamaica (13.0%, a difference of 0.32%), Delaware (13.0%, a difference of 0.70%), and Immigrants from Bahamas (12.9%, a difference of 1.4%).
| Demographics | Rating | Rank | Master's Degree |
| Immigrants | Burma/Myanmar | 5.0 /100 | #234 | Tragic 13.5% |
| German Russians | 4.5 /100 | #235 | Tragic 13.5% |
| Immigrants | Guyana | 4.4 /100 | #236 | Tragic 13.4% |
| Jamaicans | 4.1 /100 | #237 | Tragic 13.4% |
| Hmong | 4.0 /100 | #238 | Tragic 13.4% |
| Immigrants | Nonimmigrants | 3.4 /100 | #239 | Tragic 13.3% |
| Guamanians/Chamorros | 2.2 /100 | #240 | Tragic 13.1% |
| U.S. Virgin Islanders | 2.1 /100 | #241 | Tragic 13.1% |
| Spanish Americans | 1.9 /100 | #242 | Tragic 13.0% |
| Immigrants | Jamaica | 1.9 /100 | #243 | Tragic 13.0% |
| Delaware | 1.7 /100 | #244 | Tragic 13.0% |
| Immigrants | Bahamas | 1.4 /100 | #245 | Tragic 12.9% |
| Immigrants | Cambodia | 1.4 /100 | #246 | Tragic 12.9% |
| Iroquois | 1.4 /100 | #247 | Tragic 12.9% |
| Africans | 1.4 /100 | #248 | Tragic 12.9% |