Immigrants from Nepal vs Lebanese High School Diploma
COMPARE
Immigrants from Nepal
Lebanese
High School Diploma
High School Diploma Comparison
Immigrants from Nepal
Lebanese
89.3%
HIGH SCHOOL DIPLOMA
61.1/ 100
METRIC RATING
164th/ 347
METRIC RANK
90.4%
HIGH SCHOOL DIPLOMA
97.4/ 100
METRIC RATING
105th/ 347
METRIC RANK
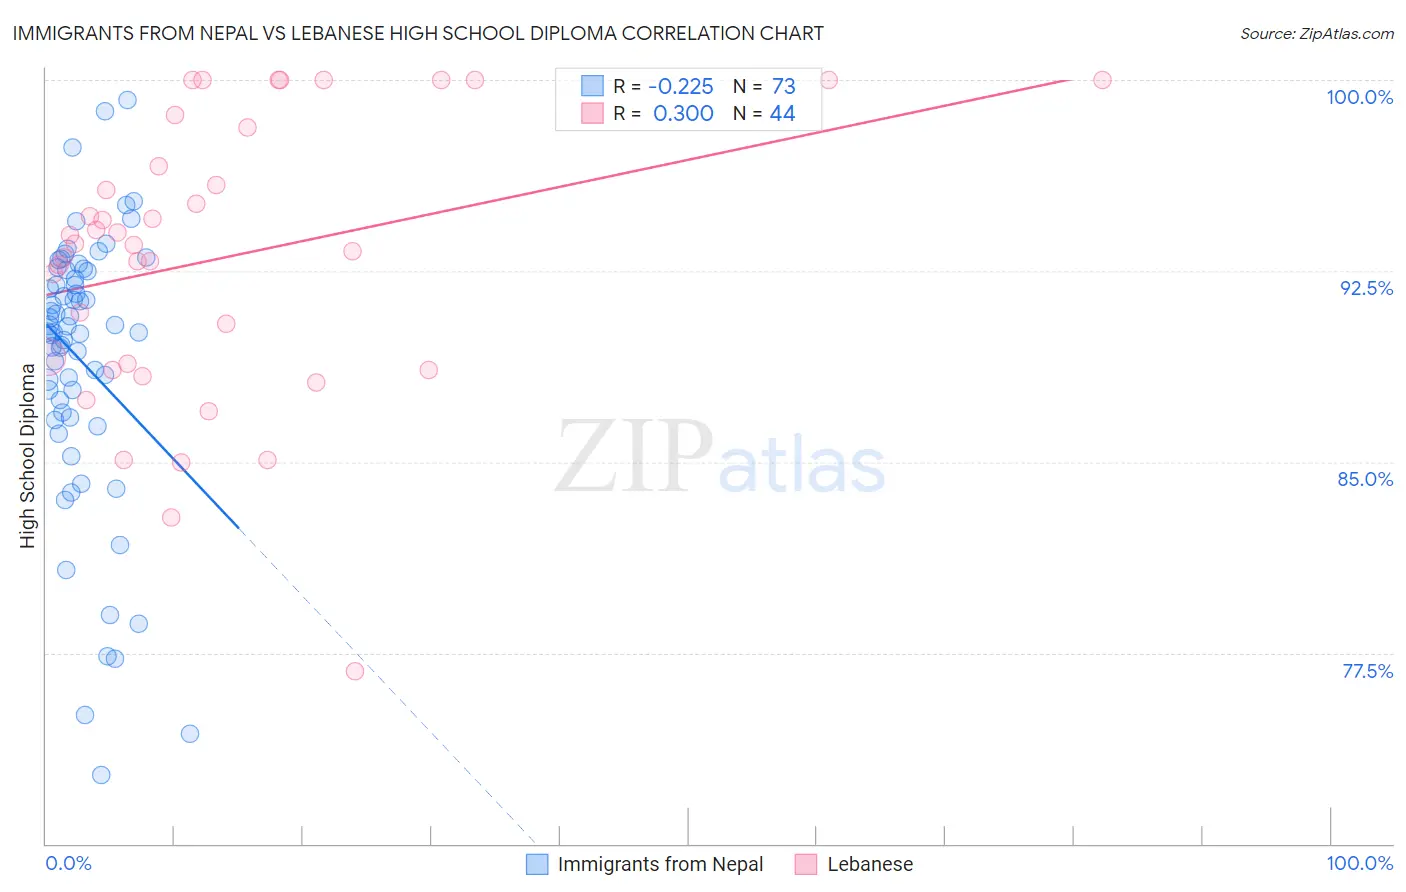
Immigrants from Nepal vs Lebanese High School Diploma Correlation Chart
The statistical analysis conducted on geographies consisting of 186,780,807 people shows a weak negative correlation between the proportion of Immigrants from Nepal and percentage of population with at least high school diploma education in the United States with a correlation coefficient (R) of -0.225 and weighted average of 89.3%. Similarly, the statistical analysis conducted on geographies consisting of 401,624,157 people shows a mild positive correlation between the proportion of Lebanese and percentage of population with at least high school diploma education in the United States with a correlation coefficient (R) of 0.300 and weighted average of 90.4%, a difference of 1.2%.
High School Diploma Correlation Summary
| Measurement | Immigrants from Nepal | Lebanese |
| Minimum | 72.7% | 76.8% |
| Maximum | 99.2% | 100.0% |
| Range | 26.5% | 23.2% |
| Mean | 89.0% | 93.0% |
| Median | 90.1% | 93.6% |
| Interquartile 25% (IQ1) | 86.9% | 88.7% |
| Interquartile 75% (IQ3) | 92.5% | 97.4% |
| Interquartile Range (IQR) | 5.6% | 8.6% |
| Standard Deviation (Sample) | 5.4% | 5.5% |
| Standard Deviation (Population) | 5.4% | 5.4% |
Similar Demographics by High School Diploma
Demographics Similar to Immigrants from Nepal by High School Diploma
In terms of high school diploma, the demographic groups most similar to Immigrants from Nepal are Brazilian (89.3%, a difference of 0.0%), Bermudan (89.3%, a difference of 0.0%), Cree (89.3%, a difference of 0.0%), Immigrants from China (89.3%, a difference of 0.010%), and Laotian (89.3%, a difference of 0.010%).
| Demographics | Rating | Rank | High School Diploma |
| Immigrants | Malaysia | 63.5 /100 | #157 | Good 89.3% |
| Immigrants | Pakistan | 62.5 /100 | #158 | Good 89.3% |
| Immigrants | China | 62.0 /100 | #159 | Good 89.3% |
| Laotians | 61.8 /100 | #160 | Good 89.3% |
| Brazilians | 61.2 /100 | #161 | Good 89.3% |
| Bermudans | 61.1 /100 | #162 | Good 89.3% |
| Cree | 61.1 /100 | #163 | Good 89.3% |
| Immigrants | Nepal | 61.1 /100 | #164 | Good 89.3% |
| Immigrants | Asia | 59.8 /100 | #165 | Average 89.3% |
| Immigrants | Albania | 59.4 /100 | #166 | Average 89.3% |
| Immigrants | Hong Kong | 58.6 /100 | #167 | Average 89.3% |
| Delaware | 55.8 /100 | #168 | Average 89.2% |
| Iroquois | 55.1 /100 | #169 | Average 89.2% |
| Immigrants | Morocco | 53.3 /100 | #170 | Average 89.2% |
| Spanish | 52.9 /100 | #171 | Average 89.2% |
Demographics Similar to Lebanese by High School Diploma
In terms of high school diploma, the demographic groups most similar to Lebanese are Syrian (90.3%, a difference of 0.050%), Immigrants from Croatia (90.4%, a difference of 0.060%), Immigrants from Romania (90.4%, a difference of 0.070%), Immigrants from Russia (90.3%, a difference of 0.070%), and Palestinian (90.3%, a difference of 0.080%).
| Demographics | Rating | Rank | High School Diploma |
| Immigrants | Korea | 98.3 /100 | #98 | Exceptional 90.5% |
| Immigrants | Europe | 98.2 /100 | #99 | Exceptional 90.5% |
| Immigrants | North Macedonia | 98.1 /100 | #100 | Exceptional 90.5% |
| Immigrants | Norway | 98.0 /100 | #101 | Exceptional 90.5% |
| Aleuts | 98.0 /100 | #102 | Exceptional 90.4% |
| Immigrants | Romania | 97.8 /100 | #103 | Exceptional 90.4% |
| Immigrants | Croatia | 97.8 /100 | #104 | Exceptional 90.4% |
| Lebanese | 97.4 /100 | #105 | Exceptional 90.4% |
| Syrians | 97.0 /100 | #106 | Exceptional 90.3% |
| Immigrants | Russia | 96.9 /100 | #107 | Exceptional 90.3% |
| Palestinians | 96.7 /100 | #108 | Exceptional 90.3% |
| Immigrants | Zimbabwe | 96.7 /100 | #109 | Exceptional 90.3% |
| Immigrants | Greece | 96.6 /100 | #110 | Exceptional 90.3% |
| Menominee | 96.6 /100 | #111 | Exceptional 90.3% |
| Immigrants | Belarus | 96.4 /100 | #112 | Exceptional 90.2% |