Immigrants from Nepal vs Cuban 5th Grade
COMPARE
Immigrants from Nepal
Cuban
5th Grade
5th Grade Comparison
Immigrants from Nepal
Cubans
97.1%
5TH GRADE
10.3/ 100
METRIC RATING
209th/ 347
METRIC RANK
96.6%
5TH GRADE
0.1/ 100
METRIC RATING
276th/ 347
METRIC RANK
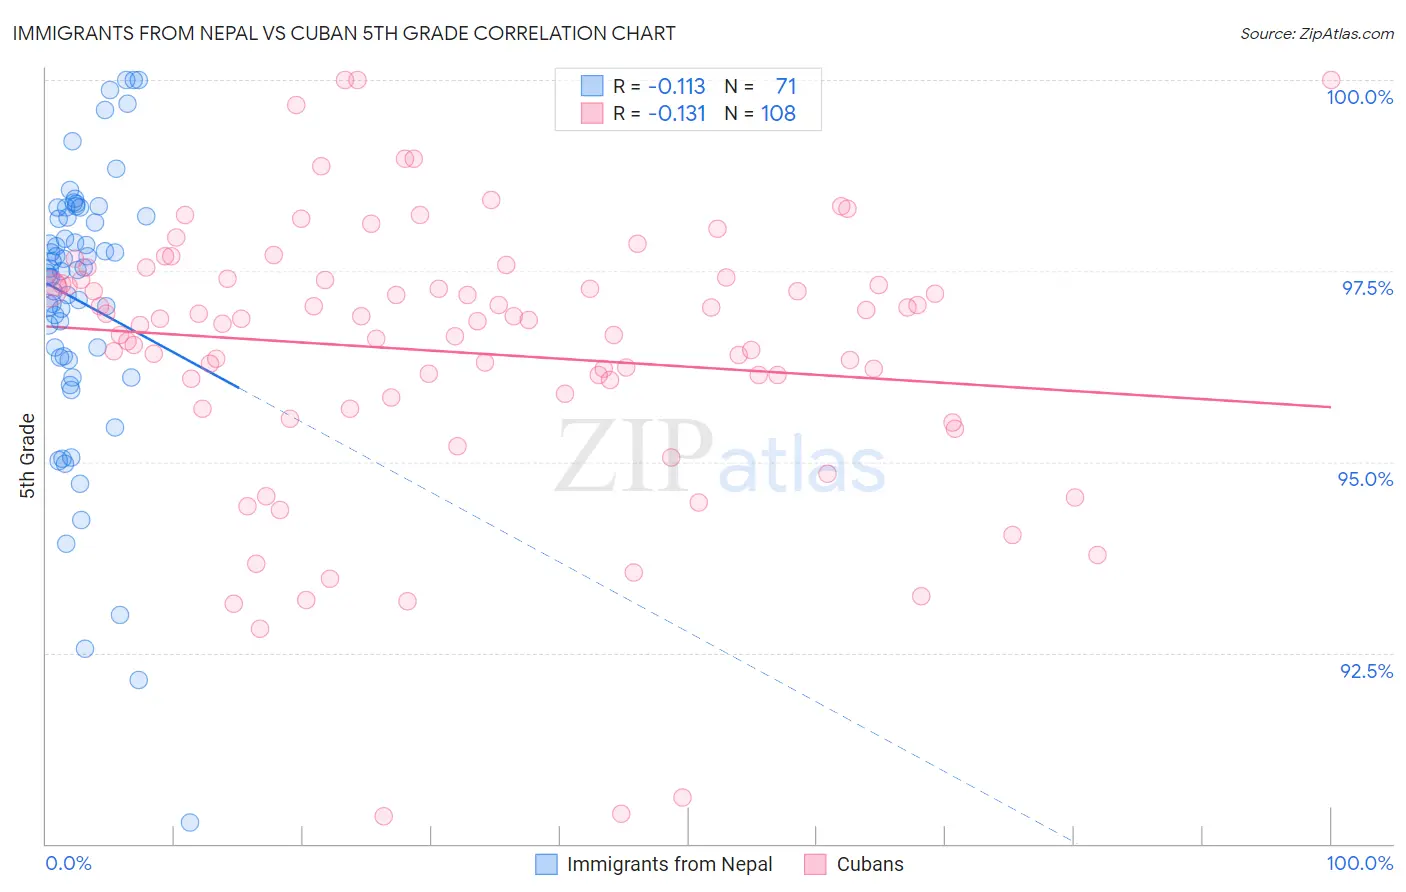
Immigrants from Nepal vs Cuban 5th Grade Correlation Chart
The statistical analysis conducted on geographies consisting of 186,739,570 people shows a poor negative correlation between the proportion of Immigrants from Nepal and percentage of population with at least 5th grade education in the United States with a correlation coefficient (R) of -0.113 and weighted average of 97.1%. Similarly, the statistical analysis conducted on geographies consisting of 449,326,865 people shows a poor negative correlation between the proportion of Cubans and percentage of population with at least 5th grade education in the United States with a correlation coefficient (R) of -0.131 and weighted average of 96.6%, a difference of 0.48%.
5th Grade Correlation Summary
| Measurement | Immigrants from Nepal | Cuban |
| Minimum | 90.3% | 90.4% |
| Maximum | 100.0% | 100.0% |
| Range | 9.7% | 9.6% |
| Mean | 97.1% | 96.4% |
| Median | 97.5% | 96.9% |
| Interquartile 25% (IQ1) | 96.4% | 95.9% |
| Interquartile 75% (IQ3) | 98.2% | 97.4% |
| Interquartile Range (IQR) | 1.9% | 1.5% |
| Standard Deviation (Sample) | 1.8% | 1.8% |
| Standard Deviation (Population) | 1.8% | 1.8% |
Similar Demographics by 5th Grade
Demographics Similar to Immigrants from Nepal by 5th Grade
In terms of 5th grade, the demographic groups most similar to Immigrants from Nepal are Immigrants from Oceania (97.1%, a difference of 0.0%), Paiute (97.1%, a difference of 0.010%), Iraqi (97.1%, a difference of 0.010%), Laotian (97.1%, a difference of 0.010%), and Moroccan (97.1%, a difference of 0.020%).
| Demographics | Rating | Rank | 5th Grade |
| Africans | 15.3 /100 | #202 | Poor 97.2% |
| Immigrants | Bahamas | 14.9 /100 | #203 | Poor 97.2% |
| Immigrants | Zaire | 13.7 /100 | #204 | Poor 97.1% |
| Moroccans | 12.0 /100 | #205 | Poor 97.1% |
| Paiute | 11.6 /100 | #206 | Poor 97.1% |
| Iraqis | 10.9 /100 | #207 | Poor 97.1% |
| Laotians | 10.8 /100 | #208 | Poor 97.1% |
| Immigrants | Nepal | 10.3 /100 | #209 | Poor 97.1% |
| Immigrants | Oceania | 10.0 /100 | #210 | Poor 97.1% |
| Samoans | 8.5 /100 | #211 | Tragic 97.1% |
| Immigrants | Iraq | 8.3 /100 | #212 | Tragic 97.1% |
| Portuguese | 7.8 /100 | #213 | Tragic 97.1% |
| Costa Ricans | 7.7 /100 | #214 | Tragic 97.1% |
| Immigrants | Morocco | 7.5 /100 | #215 | Tragic 97.1% |
| Sudanese | 7.0 /100 | #216 | Tragic 97.1% |
Demographics Similar to Cubans by 5th Grade
In terms of 5th grade, the demographic groups most similar to Cubans are Immigrants from Peru (96.6%, a difference of 0.0%), Immigrants from Bolivia (96.6%, a difference of 0.0%), Yaqui (96.7%, a difference of 0.010%), Immigrants from Cameroon (96.7%, a difference of 0.010%), and Immigrants from Ghana (96.6%, a difference of 0.010%).
| Demographics | Rating | Rank | 5th Grade |
| Ghanaians | 0.2 /100 | #269 | Tragic 96.7% |
| Afghans | 0.2 /100 | #270 | Tragic 96.7% |
| Immigrants | Hong Kong | 0.2 /100 | #271 | Tragic 96.7% |
| Trinidadians and Tobagonians | 0.1 /100 | #272 | Tragic 96.7% |
| Yaqui | 0.1 /100 | #273 | Tragic 96.7% |
| Immigrants | Cameroon | 0.1 /100 | #274 | Tragic 96.7% |
| Immigrants | Peru | 0.1 /100 | #275 | Tragic 96.6% |
| Cubans | 0.1 /100 | #276 | Tragic 96.6% |
| Immigrants | Bolivia | 0.1 /100 | #277 | Tragic 96.6% |
| Immigrants | Ghana | 0.1 /100 | #278 | Tragic 96.6% |
| Immigrants | Philippines | 0.1 /100 | #279 | Tragic 96.6% |
| Immigrants | Western Africa | 0.1 /100 | #280 | Tragic 96.6% |
| Houma | 0.1 /100 | #281 | Tragic 96.6% |
| Barbadians | 0.1 /100 | #282 | Tragic 96.6% |
| Fijians | 0.1 /100 | #283 | Tragic 96.6% |