Immigrants from Morocco vs Zimbabwean Professional Degree
COMPARE
Immigrants from Morocco
Zimbabwean
Professional Degree
Professional Degree Comparison
Immigrants from Morocco
Zimbabweans
5.0%
PROFESSIONAL DEGREE
96.8/ 100
METRIC RATING
114th/ 347
METRIC RANK
5.2%
PROFESSIONAL DEGREE
99.3/ 100
METRIC RATING
95th/ 347
METRIC RANK
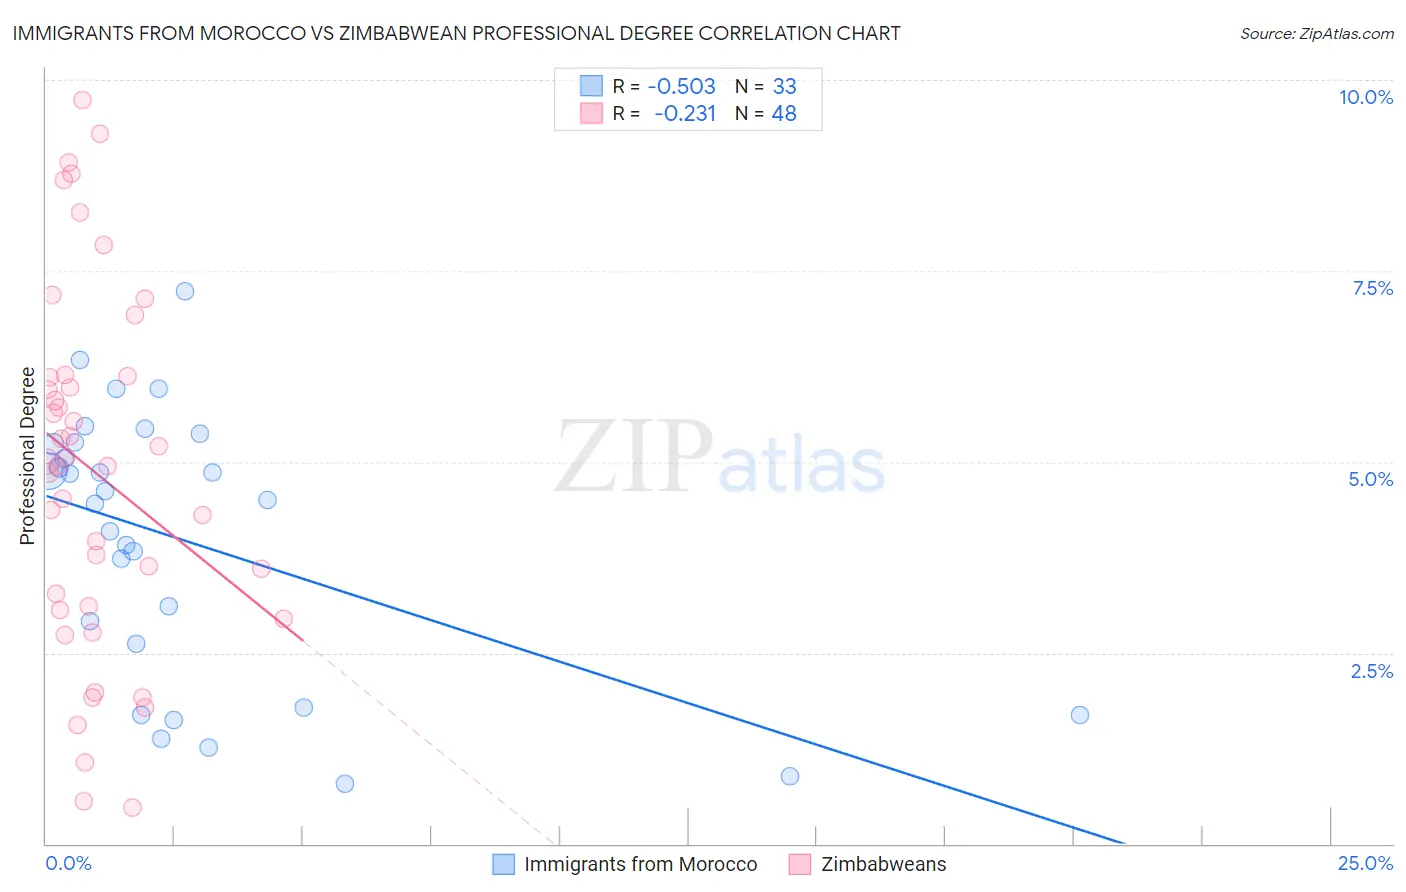
Immigrants from Morocco vs Zimbabwean Professional Degree Correlation Chart
The statistical analysis conducted on geographies consisting of 178,862,837 people shows a substantial negative correlation between the proportion of Immigrants from Morocco and percentage of population with at least professional degree education in the United States with a correlation coefficient (R) of -0.503 and weighted average of 5.0%. Similarly, the statistical analysis conducted on geographies consisting of 69,179,239 people shows a weak negative correlation between the proportion of Zimbabweans and percentage of population with at least professional degree education in the United States with a correlation coefficient (R) of -0.231 and weighted average of 5.2%, a difference of 4.9%.
Professional Degree Correlation Summary
| Measurement | Immigrants from Morocco | Zimbabwean |
| Minimum | 0.78% | 0.48% |
| Maximum | 7.2% | 9.7% |
| Range | 6.4% | 9.3% |
| Mean | 4.0% | 4.9% |
| Median | 4.5% | 5.0% |
| Interquartile 25% (IQ1) | 2.2% | 3.1% |
| Interquartile 75% (IQ3) | 5.2% | 6.1% |
| Interquartile Range (IQR) | 3.0% | 3.0% |
| Standard Deviation (Sample) | 1.8% | 2.4% |
| Standard Deviation (Population) | 1.7% | 2.3% |
Demographics Similar to Immigrants from Morocco and Zimbabweans by Professional Degree
In terms of professional degree, the demographic groups most similar to Immigrants from Morocco are Immigrants from Pakistan (5.0%, a difference of 0.45%), Taiwanese (5.0%, a difference of 0.47%), Brazilian (5.0%, a difference of 0.69%), Lebanese (5.0%, a difference of 1.4%), and British (5.0%, a difference of 1.6%). Similarly, the demographic groups most similar to Zimbabweans are Alsatian (5.2%, a difference of 0.18%), Immigrants from Uzbekistan (5.2%, a difference of 0.41%), Syrian (5.2%, a difference of 0.75%), Austrian (5.2%, a difference of 0.78%), and Immigrants from Italy (5.2%, a difference of 0.84%).
| Demographics | Rating | Rank | Professional Degree |
| Alsatians | 99.3 /100 | #94 | Exceptional 5.2% |
| Zimbabweans | 99.3 /100 | #95 | Exceptional 5.2% |
| Immigrants | Uzbekistan | 99.2 /100 | #96 | Exceptional 5.2% |
| Syrians | 99.1 /100 | #97 | Exceptional 5.2% |
| Austrians | 99.1 /100 | #98 | Exceptional 5.2% |
| Immigrants | Italy | 99.1 /100 | #99 | Exceptional 5.2% |
| Ugandans | 98.8 /100 | #100 | Exceptional 5.1% |
| Immigrants | Egypt | 98.5 /100 | #101 | Exceptional 5.1% |
| Ukrainians | 98.5 /100 | #102 | Exceptional 5.1% |
| Immigrants | Northern Africa | 98.4 /100 | #103 | Exceptional 5.1% |
| Arabs | 98.2 /100 | #104 | Exceptional 5.0% |
| Immigrants | Uganda | 98.2 /100 | #105 | Exceptional 5.0% |
| Immigrants | Ukraine | 98.2 /100 | #106 | Exceptional 5.0% |
| Maltese | 98.1 /100 | #107 | Exceptional 5.0% |
| Immigrants | Southern Europe | 98.1 /100 | #108 | Exceptional 5.0% |
| British | 98.0 /100 | #109 | Exceptional 5.0% |
| Lebanese | 98.0 /100 | #110 | Exceptional 5.0% |
| Brazilians | 97.4 /100 | #111 | Exceptional 5.0% |
| Taiwanese | 97.3 /100 | #112 | Exceptional 5.0% |
| Immigrants | Pakistan | 97.2 /100 | #113 | Exceptional 5.0% |
| Immigrants | Morocco | 96.8 /100 | #114 | Exceptional 5.0% |