Immigrants from Morocco vs Menominee 3rd Grade

COMPARE

Immigrants from Morocco
Race
Ancestry
AfghanAfricanAlaska NativeAlaskan AthabascanAlbanianAleutAlsatianAmericanApacheArabArapahoArgentineanArmenianAssyrian/Chaldean/SyriacAustralianAustrianBahamianBangladeshiBarbadianBasqueBelgianBelizeanBermudanBhutaneseBlackfeetBolivianBrazilianBritishBritish West IndianBulgarianBurmeseCajunCambodianCanadianCape VerdeanCarpatho RusynCelticCentral AmericanCentral American IndianCherokeeCheyenneChickasawChileanChineseChippewaChoctawColombianColvilleComancheCosta RicanCreeCreekCroatianCrowCubanCypriotCzechCzechoslovakianDanishDelawareDominicanDutchDutch West IndianEastern EuropeanEcuadorianEgyptianEnglishEstonianEthiopianEuropeanFijianFilipinoFinnishFrenchFrench American IndianFrench CanadianGermanGerman RussianGhanaianGreekGuamanian/ChamorroGuatemalanGuyaneseHaitianHmongHonduranHopiHoumaHungarianIcelanderIndian (Asian)IndonesianInupiatIranianIraqiIrishIroquoisIsraeliItalianJamaicanJapaneseJordanianKenyanKiowaKoreanLaotianLatvianLebaneseLiberianLithuanianLumbeeLuxembourgerMacedonianMalaysianMalteseMarshalleseMexicanMexican American IndianMongolianMoroccanNative HawaiianNavajoNepaleseNew ZealanderNicaraguanNigerianNorthern EuropeanNorwegianOkinawanOsageOttawaPaiutePakistaniPalestinianPanamanianParaguayanPennsylvania GermanPeruvianPimaPolishPortuguesePotawatomiPuebloPuerto RicanPuget Sound SalishRomanianRussianSalvadoranSamoanScandinavianScotch-IrishScottishSeminoleSenegaleseSerbianShoshoneSierra LeoneanSiouxSlavicSlovakSloveneSomaliSouth AfricanSouth AmericanSouth American IndianSoviet UnionSpaniardSpanishSpanish AmericanSpanish American IndianSri LankanSubsaharan AfricanSudaneseSwedishSwissSyrianTaiwaneseThaiTlingit-HaidaTohono O'OdhamTonganTrinidadian and TobagonianTsimshianTurkishU.S. Virgin IslanderUgandanUkrainianUruguayanUteVenezuelanVietnameseWelshWest IndianYakamaYaquiYugoslavianYumanYup'ikZimbabwean
Immigration
NonimmigrantsImmigrantsAfghanistanAfricaAlbaniaArgentinaArmeniaAsiaAustraliaAustriaBahamasBangladeshBarbadosBelarusBelgiumBelizeBoliviaBosnia and HerzegovinaBrazilBulgariaBurma/MyanmarCabo VerdeCambodiaCameroonCanadaCaribbeanCentral AmericaChileChinaColombiaCongoCosta RicaCroatiaCubaCzechoslovakiaDenmarkDominicaDominican RepublicEastern AfricaEastern AsiaEastern EuropeEcuadorEgyptEl SalvadorEnglandEritreaEthiopiaEuropeFijiFranceGermanyGhanaGreeceGrenadaGuatemalaGuyanaHaitiHondurasHong KongHungaryIndiaIndonesiaIranIraqIrelandIsraelItalyJamaicaJapanJordanKazakhstanKenyaKoreaKuwaitLaosLatin AmericaLatviaLebanonLiberiaLithuaniaMalaysiaMexicoMicronesiaMiddle AfricaMoldovaMoroccoNepalNetherlandsNicaraguaNigeriaNorth AmericaNorth MacedoniaNorthern AfricaNorthern EuropeNorwayOceaniaPakistanPanamaPeruPhilippinesPolandPortugalRomaniaRussiaSaudi ArabiaScotlandSenegalSerbiaSierra LeoneSingaporeSomaliaSouth AfricaSouth AmericaSouth Central AsiaSouth Eastern AsiaSouthern EuropeSpainSri LankaSt. Vincent and the GrenadinesSudanSwedenSwitzerlandSyriaTaiwanThailandTrinidad and TobagoTurkeyUgandaUkraineUruguayUzbekistanVenezuelaVietnamWest IndiesWestern AfricaWestern AsiaWestern EuropeYemenZaireZimbabweAzores
Menominee
Race
Ancestry
AfghanAfricanAlaska NativeAlaskan AthabascanAlbanianAleutAlsatianAmericanApacheArabArapahoArgentineanArmenianAssyrian/Chaldean/SyriacAustralianAustrianBahamianBangladeshiBarbadianBasqueBelgianBelizeanBermudanBhutaneseBlackfeetBolivianBrazilianBritishBritish West IndianBulgarianBurmeseCajunCambodianCanadianCape VerdeanCarpatho RusynCelticCentral AmericanCentral American IndianCherokeeCheyenneChickasawChileanChineseChippewaChoctawColombianColvilleComancheCosta RicanCreeCreekCroatianCrowCubanCypriotCzechCzechoslovakianDanishDelawareDominicanDutchDutch West IndianEastern EuropeanEcuadorianEgyptianEnglishEstonianEthiopianEuropeanFijianFilipinoFinnishFrenchFrench American IndianFrench CanadianGermanGerman RussianGhanaianGreekGuamanian/ChamorroGuatemalanGuyaneseHaitianHmongHonduranHopiHoumaHungarianIcelanderIndian (Asian)IndonesianInupiatIranianIraqiIrishIroquoisIsraeliItalianJamaicanJapaneseJordanianKenyanKiowaKoreanLaotianLatvianLebaneseLiberianLithuanianLumbeeLuxembourgerMacedonianMalaysianMalteseMarshalleseMenomineeMexicanMexican American IndianMongolianMoroccanNative HawaiianNavajoNepaleseNew ZealanderNicaraguanNigerianNorthern EuropeanNorwegianOkinawanOsageOttawaPaiutePakistaniPalestinianPanamanianParaguayanPennsylvania GermanPeruvianPimaPolishPortuguesePotawatomiPuebloPuerto RicanPuget Sound SalishRomanianRussianSalvadoranSamoanScandinavianScotch-IrishScottishSeminoleSenegaleseSerbianShoshoneSierra LeoneanSiouxSlavicSlovakSloveneSomaliSouth AfricanSouth AmericanSouth American IndianSoviet UnionSpaniardSpanishSpanish AmericanSpanish American IndianSri LankanSubsaharan AfricanSudaneseSwedishSwissSyrianTaiwaneseThaiTlingit-HaidaTohono O'OdhamTonganTrinidadian and TobagonianTsimshianTurkishU.S. Virgin IslanderUgandanUkrainianUruguayanUteVenezuelanVietnameseWelshWest IndianYakamaYaquiYugoslavianYumanYup'ikZimbabwean
Immigration
NonimmigrantsImmigrantsAfghanistanAfricaAlbaniaArgentinaArmeniaAsiaAustraliaAustriaBahamasBangladeshBarbadosBelarusBelgiumBelizeBoliviaBosnia and HerzegovinaBrazilBulgariaBurma/MyanmarCabo VerdeCambodiaCameroonCanadaCaribbeanCentral AmericaChileChinaColombiaCongoCosta RicaCroatiaCubaCzechoslovakiaDenmarkDominicaDominican RepublicEastern AfricaEastern AsiaEastern EuropeEcuadorEgyptEl SalvadorEnglandEritreaEthiopiaEuropeFijiFranceGermanyGhanaGreeceGrenadaGuatemalaGuyanaHaitiHondurasHong KongHungaryIndiaIndonesiaIranIraqIrelandIsraelItalyJamaicaJapanJordanKazakhstanKenyaKoreaKuwaitLaosLatin AmericaLatviaLebanonLiberiaLithuaniaMalaysiaMexicoMicronesiaMiddle AfricaMoldovaNepalNetherlandsNicaraguaNigeriaNorth AmericaNorth MacedoniaNorthern AfricaNorthern EuropeNorwayOceaniaPakistanPanamaPeruPhilippinesPolandPortugalRomaniaRussiaSaudi ArabiaScotlandSenegalSerbiaSierra LeoneSingaporeSomaliaSouth AfricaSouth AmericaSouth Central AsiaSouth Eastern AsiaSouthern EuropeSpainSri LankaSt. Vincent and the GrenadinesSudanSwedenSwitzerlandSyriaTaiwanThailandTrinidad and TobagoTurkeyUgandaUkraineUruguayUzbekistanVenezuelaVietnamWest IndiesWestern AfricaWestern AsiaWestern EuropeYemenZaireZimbabweAzores
3rd Grade
Income
Poverty
Unemployment
Labor Participation
Family Structure
Vehicle Availability
Education Level
Disability

3rd Grade Comparison

Immigrants from Morocco

Menominee

Tragic
Exceptional
97.5%
3RD GRADE
5.0/ 100
METRIC RATING
220th/ 347
METRIC RANK
98.0%
3RD GRADE
95.4/ 100
METRIC RATING
114th/ 347
METRIC RANK

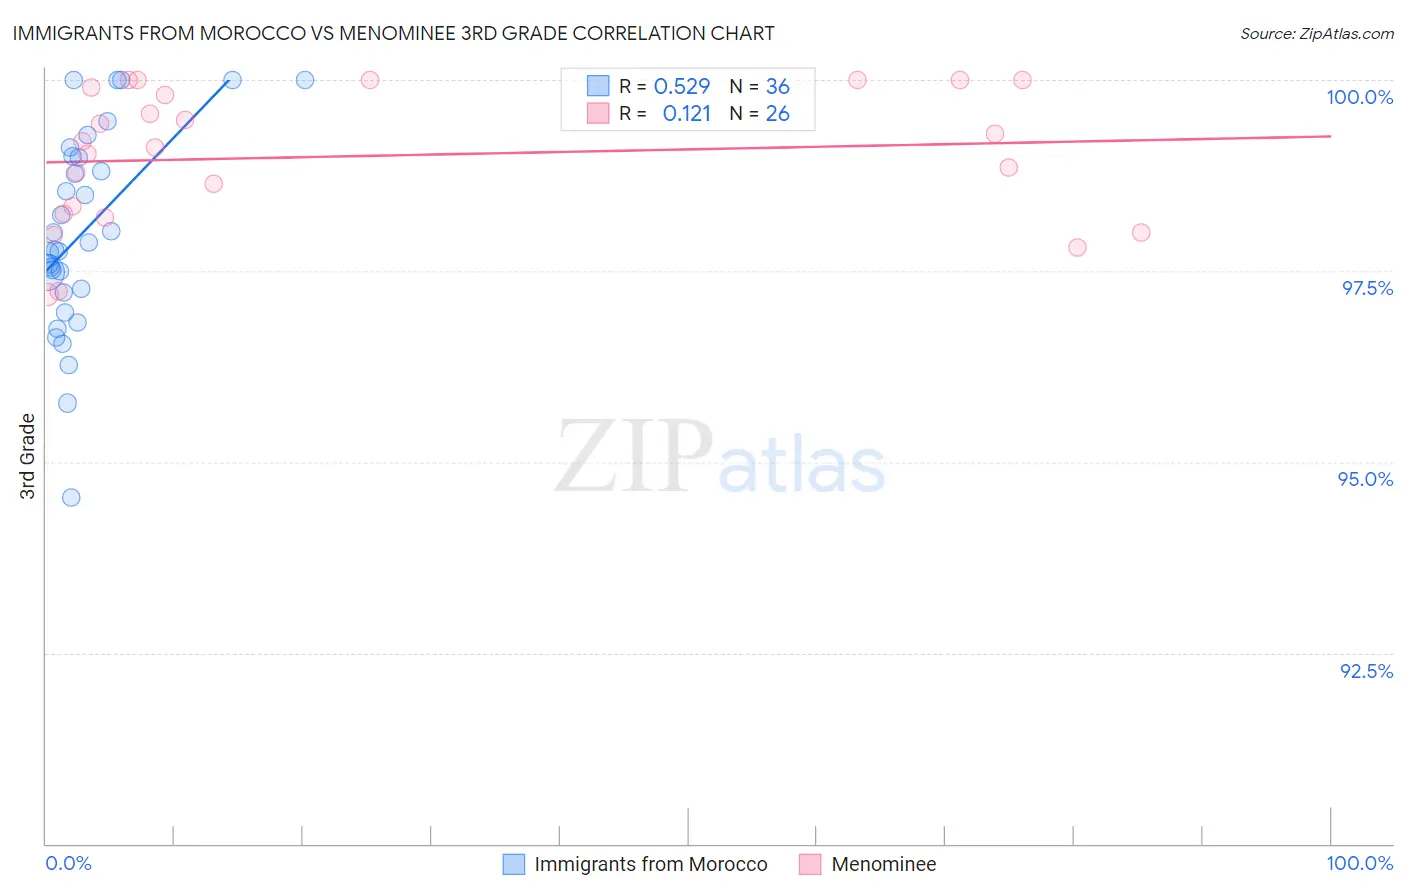
Immigrants from Morocco vs Menominee 3rd Grade Correlation Chart

The statistical analysis conducted on geographies consisting of 178,910,634 people shows a substantial positive correlation between the proportion of Immigrants from Morocco and percentage of population with at least 3rd grade education in the United States with a correlation coefficient (R) of 0.529 and weighted average of 97.5%. Similarly, the statistical analysis conducted on geographies consisting of 45,778,979 people shows a poor positive correlation between the proportion of Menominee and percentage of population with at least 3rd grade education in the United States with a correlation coefficient (R) of 0.121 and weighted average of 98.0%, a difference of 0.51%.
Immigrants from Morocco vs Menominee 3rd Grade

3rd Grade Correlation Summary

MeasurementImmigrants from MoroccoMenominee
Minimum94.5%97.2%
Maximum100.0%100.0%
Range5.5%2.8%
Mean98.0%99.0%
Median97.8%99.2%
Interquartile 25% (IQ1)97.2%98.3%
Interquartile 75% (IQ3)99.0%99.9%
Interquartile Range (IQR)1.7%1.6%
Standard Deviation (Sample)1.3%0.89%
Standard Deviation (Population)1.3%0.88%

Similar Demographics by 3rd Grade

Demographics Similar to Immigrants from Morocco by 3rd Grade

In terms of 3rd grade, the demographic groups most similar to Immigrants from Morocco are Immigrants from Nepal (97.5%, a difference of 0.0%), Immigrants from Panama (97.5%, a difference of 0.0%), Uruguayan (97.5%, a difference of 0.0%), South American Indian (97.5%, a difference of 0.010%), and Sierra Leonean (97.5%, a difference of 0.010%).
DemographicsRating | Rank3rd Grade
Moroccans
8.5
/100
|
#213
Tragic
97.6%
Yuman
8.4
/100
|
#214
Tragic
97.6%
Iraqis
6.9
/100
|
#215
Tragic
97.5%
Samoans
6.9
/100
|
#216
Tragic
97.5%
South American Indians
5.7
/100
|
#217
Tragic
97.5%
Immigrants | Nepal
5.3
/100
|
#218
Tragic
97.5%
Immigrants | Panama
5.2
/100
|
#219
Tragic
97.5%
Immigrants | Morocco
5.0
/100
|
#220
Tragic
97.5%
Uruguayans
5.0
/100
|
#221
Tragic
97.5%
Sierra Leoneans
4.6
/100
|
#222
Tragic
97.5%
Immigrants | Syria
4.4
/100
|
#223
Tragic
97.5%
Bahamians
4.4
/100
|
#224
Tragic
97.5%
Tongans
4.3
/100
|
#225
Tragic
97.5%
Sudanese
4.1
/100
|
#226
Tragic
97.5%
Immigrants | Sudan
3.4
/100
|
#227
Tragic
97.5%

Demographics Similar to Menominee by 3rd Grade

In terms of 3rd grade, the demographic groups most similar to Menominee are Thai (98.0%, a difference of 0.0%), Okinawan (98.0%, a difference of 0.0%), Immigrants from Norway (98.0%, a difference of 0.0%), Immigrants from Latvia (98.0%, a difference of 0.010%), and Immigrants from France (98.0%, a difference of 0.010%).
DemographicsRating | Rank3rd Grade
Immigrants | Czechoslovakia
97.0
/100
|
#107
Exceptional
98.0%
Immigrants | Singapore
96.7
/100
|
#108
Exceptional
98.0%
Pima
96.7
/100
|
#109
Exceptional
98.0%
Immigrants | Switzerland
96.6
/100
|
#110
Exceptional
98.0%
Basques
96.5
/100
|
#111
Exceptional
98.0%
Immigrants | Latvia
96.0
/100
|
#112
Exceptional
98.0%
Thais
95.5
/100
|
#113
Exceptional
98.0%
Menominee
95.4
/100
|
#114
Exceptional
98.0%
Okinawans
95.2
/100
|
#115
Exceptional
98.0%
Immigrants | Norway
95.2
/100
|
#116
Exceptional
98.0%
Immigrants | France
95.1
/100
|
#117
Exceptional
98.0%
Iranians
94.9
/100
|
#118
Exceptional
98.0%
Spanish
94.8
/100
|
#119
Exceptional
98.0%
Immigrants | Croatia
94.4
/100
|
#120
Exceptional
98.0%
Iroquois
94.1
/100
|
#121
Exceptional
98.0%