Immigrants from Moldova vs Ukrainian High School Diploma
COMPARE
Immigrants from Moldova
Ukrainian
High School Diploma
High School Diploma Comparison
Immigrants from Moldova
Ukrainians
90.7%
HIGH SCHOOL DIPLOMA
99.2/ 100
METRIC RATING
83rd/ 347
METRIC RANK
91.0%
HIGH SCHOOL DIPLOMA
99.6/ 100
METRIC RATING
64th/ 347
METRIC RANK
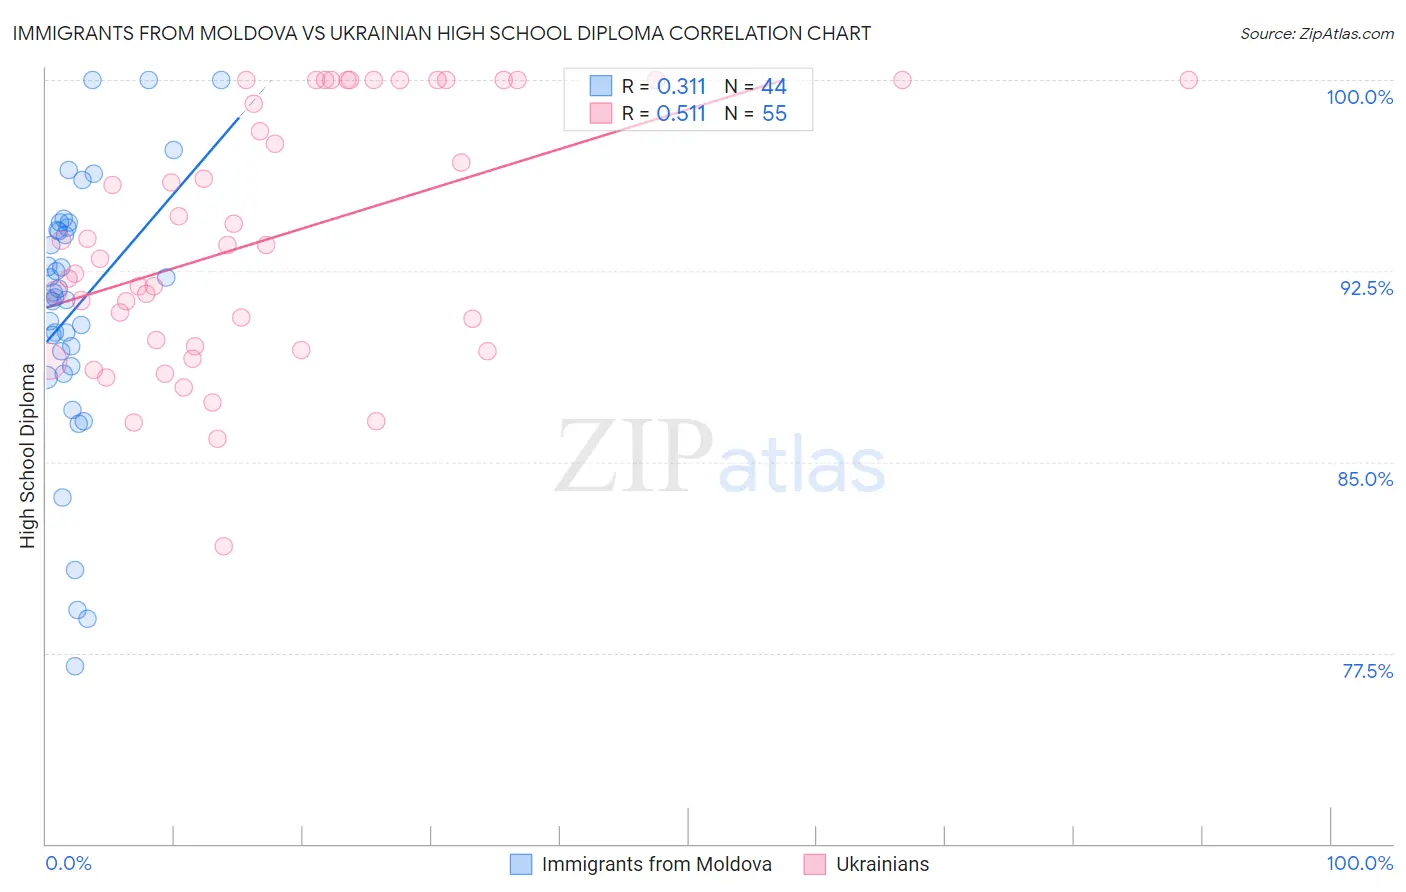
Immigrants from Moldova vs Ukrainian High School Diploma Correlation Chart
The statistical analysis conducted on geographies consisting of 124,401,069 people shows a mild positive correlation between the proportion of Immigrants from Moldova and percentage of population with at least high school diploma education in the United States with a correlation coefficient (R) of 0.311 and weighted average of 90.7%. Similarly, the statistical analysis conducted on geographies consisting of 448,696,775 people shows a substantial positive correlation between the proportion of Ukrainians and percentage of population with at least high school diploma education in the United States with a correlation coefficient (R) of 0.511 and weighted average of 91.0%, a difference of 0.24%.
High School Diploma Correlation Summary
| Measurement | Immigrants from Moldova | Ukrainian |
| Minimum | 77.0% | 81.7% |
| Maximum | 100.0% | 100.0% |
| Range | 23.0% | 18.3% |
| Mean | 91.0% | 93.8% |
| Median | 91.6% | 93.5% |
| Interquartile 25% (IQ1) | 89.0% | 89.6% |
| Interquartile 75% (IQ3) | 94.2% | 100.0% |
| Interquartile Range (IQR) | 5.1% | 10.4% |
| Standard Deviation (Sample) | 5.3% | 4.9% |
| Standard Deviation (Population) | 5.2% | 4.9% |
Demographics Similar to Immigrants from Moldova and Ukrainians by High School Diploma
In terms of high school diploma, the demographic groups most similar to Immigrants from Moldova are Scotch-Irish (90.8%, a difference of 0.020%), Immigrants from Switzerland (90.8%, a difference of 0.050%), Immigrants from England (90.8%, a difference of 0.060%), Immigrants from Denmark (90.8%, a difference of 0.070%), and Hungarian (90.8%, a difference of 0.080%). Similarly, the demographic groups most similar to Ukrainians are Immigrants from South Africa (91.0%, a difference of 0.0%), Immigrants from Netherlands (91.0%, a difference of 0.010%), French (91.0%, a difference of 0.010%), Immigrants from Iran (90.9%, a difference of 0.030%), and Czechoslovakian (90.9%, a difference of 0.040%).
| Demographics | Rating | Rank | High School Diploma |
| Immigrants | Netherlands | 99.6 /100 | #63 | Exceptional 91.0% |
| Ukrainians | 99.6 /100 | #64 | Exceptional 91.0% |
| Immigrants | South Africa | 99.6 /100 | #65 | Exceptional 91.0% |
| French | 99.5 /100 | #66 | Exceptional 91.0% |
| Immigrants | Iran | 99.5 /100 | #67 | Exceptional 90.9% |
| Czechoslovakians | 99.5 /100 | #68 | Exceptional 90.9% |
| French Canadians | 99.5 /100 | #69 | Exceptional 90.9% |
| Immigrants | Latvia | 99.5 /100 | #70 | Exceptional 90.9% |
| Alaskan Athabascans | 99.4 /100 | #71 | Exceptional 90.9% |
| Soviet Union | 99.4 /100 | #72 | Exceptional 90.9% |
| Immigrants | South Central Asia | 99.4 /100 | #73 | Exceptional 90.9% |
| Immigrants | Czechoslovakia | 99.4 /100 | #74 | Exceptional 90.9% |
| Cambodians | 99.4 /100 | #75 | Exceptional 90.8% |
| Hungarians | 99.3 /100 | #76 | Exceptional 90.8% |
| Native Hawaiians | 99.3 /100 | #77 | Exceptional 90.8% |
| Burmese | 99.3 /100 | #78 | Exceptional 90.8% |
| Immigrants | Denmark | 99.3 /100 | #79 | Exceptional 90.8% |
| Immigrants | England | 99.3 /100 | #80 | Exceptional 90.8% |
| Immigrants | Switzerland | 99.3 /100 | #81 | Exceptional 90.8% |
| Scotch-Irish | 99.2 /100 | #82 | Exceptional 90.8% |
| Immigrants | Moldova | 99.2 /100 | #83 | Exceptional 90.7% |