Immigrants from Moldova vs Kiowa Doctorate Degree
COMPARE
Immigrants from Moldova
Kiowa
Doctorate Degree
Doctorate Degree Comparison
Immigrants from Moldova
Kiowa
2.0%
DOCTORATE DEGREE
84.3/ 100
METRIC RATING
144th/ 347
METRIC RANK
1.5%
DOCTORATE DEGREE
0.5/ 100
METRIC RATING
267th/ 347
METRIC RANK
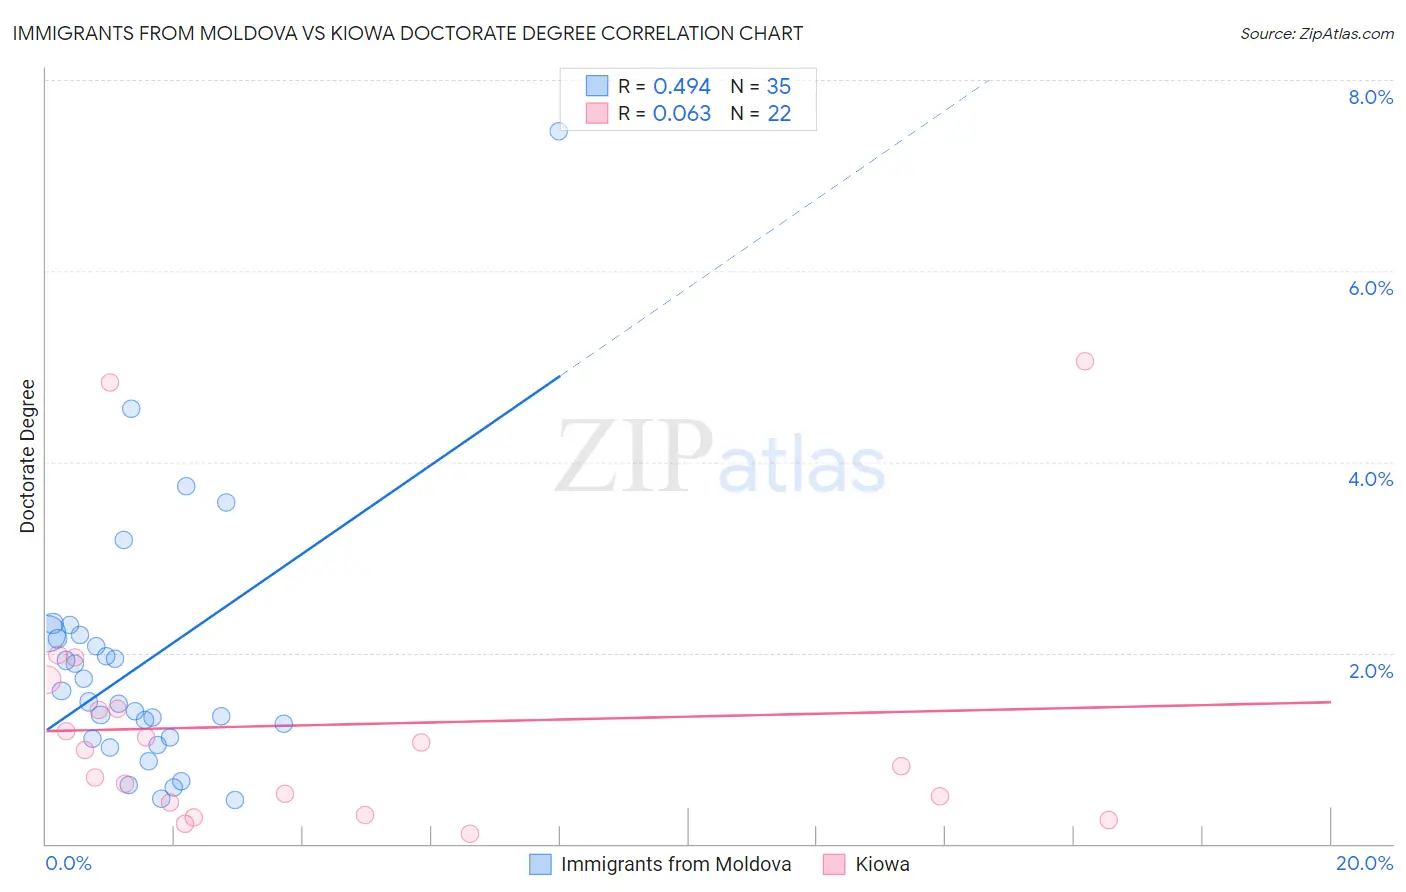
Immigrants from Moldova vs Kiowa Doctorate Degree Correlation Chart
The statistical analysis conducted on geographies consisting of 124,175,458 people shows a moderate positive correlation between the proportion of Immigrants from Moldova and percentage of population with at least doctorate degree education in the United States with a correlation coefficient (R) of 0.494 and weighted average of 2.0%. Similarly, the statistical analysis conducted on geographies consisting of 55,816,646 people shows a slight positive correlation between the proportion of Kiowa and percentage of population with at least doctorate degree education in the United States with a correlation coefficient (R) of 0.063 and weighted average of 1.5%, a difference of 32.0%.
Doctorate Degree Correlation Summary
| Measurement | Immigrants from Moldova | Kiowa |
| Minimum | 0.45% | 0.10% |
| Maximum | 7.5% | 5.1% |
| Range | 7.0% | 4.9% |
| Mean | 1.9% | 1.2% |
| Median | 1.5% | 0.90% |
| Interquartile 25% (IQ1) | 1.1% | 0.44% |
| Interquartile 75% (IQ3) | 2.2% | 1.4% |
| Interquartile Range (IQR) | 1.1% | 0.98% |
| Standard Deviation (Sample) | 1.3% | 1.3% |
| Standard Deviation (Population) | 1.3% | 1.3% |
Similar Demographics by Doctorate Degree
Demographics Similar to Immigrants from Moldova by Doctorate Degree
In terms of doctorate degree, the demographic groups most similar to Immigrants from Moldova are Kenyan (1.9%, a difference of 0.18%), Immigrants from Syria (1.9%, a difference of 0.20%), Sierra Leonean (2.0%, a difference of 0.21%), Immigrants from Senegal (1.9%, a difference of 0.45%), and Italian (2.0%, a difference of 0.46%).
| Demographics | Rating | Rank | Doctorate Degree |
| South American Indians | 88.3 /100 | #137 | Excellent 2.0% |
| Swiss | 88.0 /100 | #138 | Excellent 2.0% |
| Afghans | 87.2 /100 | #139 | Excellent 2.0% |
| Immigrants | Africa | 87.0 /100 | #140 | Excellent 2.0% |
| Senegalese | 86.7 /100 | #141 | Excellent 2.0% |
| Italians | 86.0 /100 | #142 | Excellent 2.0% |
| Sierra Leoneans | 85.1 /100 | #143 | Excellent 2.0% |
| Immigrants | Moldova | 84.3 /100 | #144 | Excellent 2.0% |
| Kenyans | 83.6 /100 | #145 | Excellent 1.9% |
| Immigrants | Syria | 83.6 /100 | #146 | Excellent 1.9% |
| Immigrants | Senegal | 82.5 /100 | #147 | Excellent 1.9% |
| Luxembourgers | 81.1 /100 | #148 | Excellent 1.9% |
| Basques | 76.9 /100 | #149 | Good 1.9% |
| English | 75.9 /100 | #150 | Good 1.9% |
| Albanians | 74.8 /100 | #151 | Good 1.9% |
Demographics Similar to Kiowa by Doctorate Degree
In terms of doctorate degree, the demographic groups most similar to Kiowa are U.S. Virgin Islander (1.5%, a difference of 0.0%), Crow (1.5%, a difference of 0.090%), Salvadoran (1.5%, a difference of 0.12%), Immigrants from Trinidad and Tobago (1.5%, a difference of 0.19%), and Immigrants from Barbados (1.5%, a difference of 0.28%).
| Demographics | Rating | Rank | Doctorate Degree |
| Japanese | 0.9 /100 | #260 | Tragic 1.5% |
| Immigrants | Portugal | 0.8 /100 | #261 | Tragic 1.5% |
| Chickasaw | 0.7 /100 | #262 | Tragic 1.5% |
| Immigrants | Bahamas | 0.7 /100 | #263 | Tragic 1.5% |
| Blackfeet | 0.7 /100 | #264 | Tragic 1.5% |
| Nicaraguans | 0.6 /100 | #265 | Tragic 1.5% |
| Immigrants | Liberia | 0.5 /100 | #266 | Tragic 1.5% |
| Kiowa | 0.5 /100 | #267 | Tragic 1.5% |
| U.S. Virgin Islanders | 0.5 /100 | #268 | Tragic 1.5% |
| Crow | 0.5 /100 | #269 | Tragic 1.5% |
| Salvadorans | 0.5 /100 | #270 | Tragic 1.5% |
| Immigrants | Trinidad and Tobago | 0.5 /100 | #271 | Tragic 1.5% |
| Immigrants | Barbados | 0.4 /100 | #272 | Tragic 1.5% |
| Sioux | 0.4 /100 | #273 | Tragic 1.5% |
| Yaqui | 0.4 /100 | #274 | Tragic 1.5% |