Immigrants from Moldova vs Hungarian 6th Grade
COMPARE
Immigrants from Moldova
Hungarian
6th Grade
6th Grade Comparison
Immigrants from Moldova
Hungarians
97.3%
6TH GRADE
90.0/ 100
METRIC RATING
133rd/ 347
METRIC RANK
97.8%
6TH GRADE
99.9/ 100
METRIC RATING
42nd/ 347
METRIC RANK
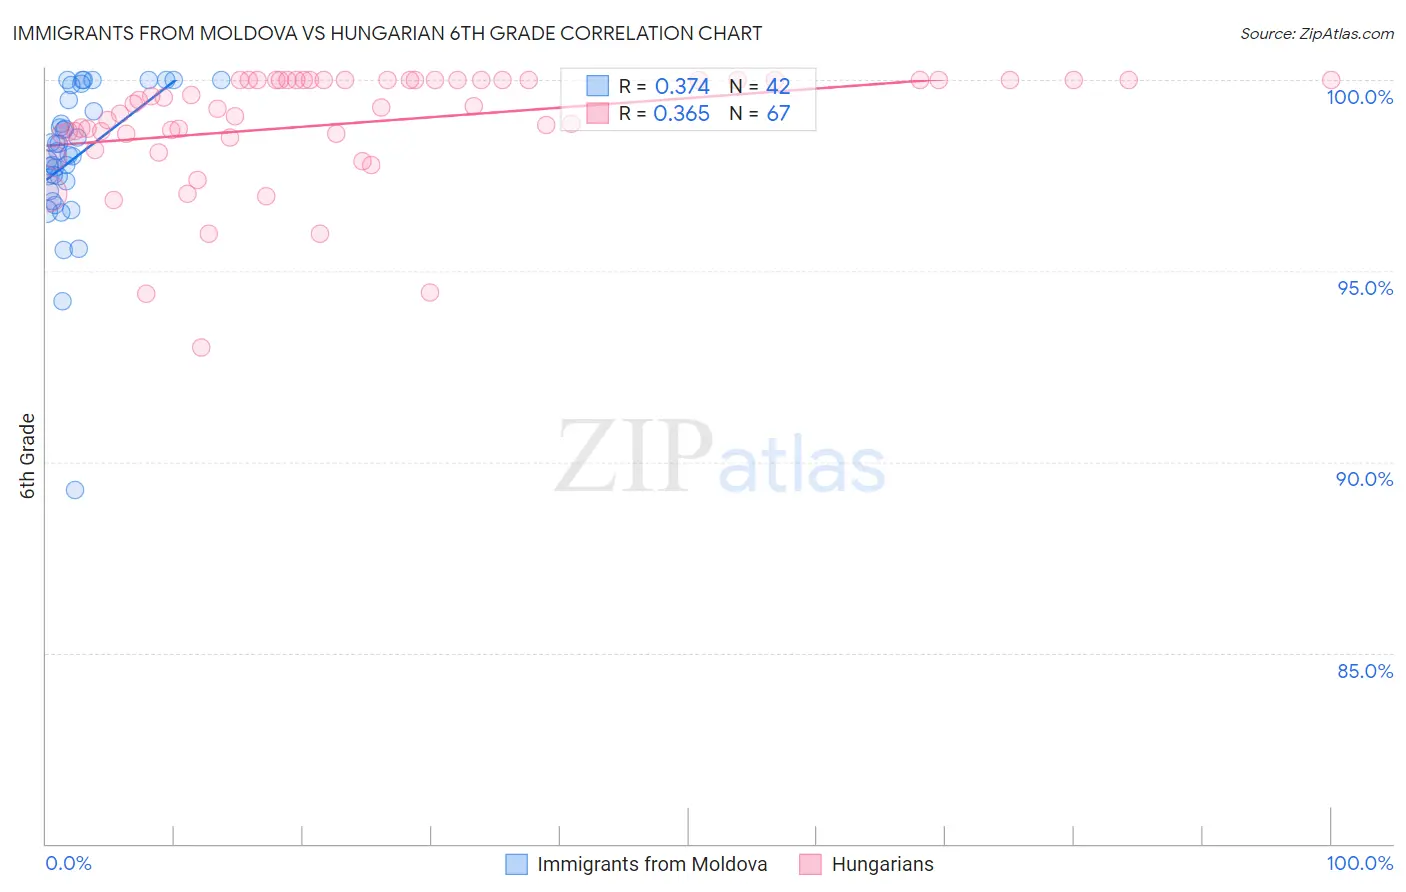
Immigrants from Moldova vs Hungarian 6th Grade Correlation Chart
The statistical analysis conducted on geographies consisting of 124,396,843 people shows a mild positive correlation between the proportion of Immigrants from Moldova and percentage of population with at least 6th grade education in the United States with a correlation coefficient (R) of 0.374 and weighted average of 97.3%. Similarly, the statistical analysis conducted on geographies consisting of 486,239,314 people shows a mild positive correlation between the proportion of Hungarians and percentage of population with at least 6th grade education in the United States with a correlation coefficient (R) of 0.365 and weighted average of 97.8%, a difference of 0.57%.
6th Grade Correlation Summary
| Measurement | Immigrants from Moldova | Hungarian |
| Minimum | 89.3% | 93.0% |
| Maximum | 100.0% | 100.0% |
| Range | 10.7% | 7.0% |
| Mean | 98.0% | 98.9% |
| Median | 98.1% | 99.3% |
| Interquartile 25% (IQ1) | 97.3% | 98.6% |
| Interquartile 75% (IQ3) | 99.5% | 100.0% |
| Interquartile Range (IQR) | 2.2% | 1.4% |
| Standard Deviation (Sample) | 2.0% | 1.5% |
| Standard Deviation (Population) | 2.0% | 1.5% |
Similar Demographics by 6th Grade
Demographics Similar to Immigrants from Moldova by 6th Grade
In terms of 6th grade, the demographic groups most similar to Immigrants from Moldova are Immigrants from Europe (97.3%, a difference of 0.010%), Palestinian (97.3%, a difference of 0.010%), Immigrants from Kuwait (97.3%, a difference of 0.010%), Immigrants from Hungary (97.3%, a difference of 0.010%), and Filipino (97.3%, a difference of 0.010%).
| Demographics | Rating | Rank | 6th Grade |
| Immigrants | Bulgaria | 93.6 /100 | #126 | Exceptional 97.3% |
| Immigrants | Croatia | 93.1 /100 | #127 | Exceptional 97.3% |
| Immigrants | Romania | 92.0 /100 | #128 | Exceptional 97.3% |
| Immigrants | Serbia | 91.9 /100 | #129 | Exceptional 97.3% |
| Cambodians | 91.8 /100 | #130 | Exceptional 97.3% |
| Immigrants | Europe | 91.1 /100 | #131 | Exceptional 97.3% |
| Palestinians | 90.9 /100 | #132 | Exceptional 97.3% |
| Immigrants | Moldova | 90.0 /100 | #133 | Excellent 97.3% |
| Immigrants | Kuwait | 89.5 /100 | #134 | Excellent 97.3% |
| Immigrants | Hungary | 89.5 /100 | #135 | Excellent 97.3% |
| Filipinos | 88.9 /100 | #136 | Excellent 97.3% |
| Burmese | 87.8 /100 | #137 | Excellent 97.3% |
| Blackfeet | 87.7 /100 | #138 | Excellent 97.3% |
| Immigrants | Turkey | 86.1 /100 | #139 | Excellent 97.3% |
| Immigrants | North Macedonia | 85.5 /100 | #140 | Excellent 97.2% |
Demographics Similar to Hungarians by 6th Grade
In terms of 6th grade, the demographic groups most similar to Hungarians are Eastern European (97.9%, a difference of 0.010%), Northern European (97.8%, a difference of 0.010%), Latvian (97.9%, a difference of 0.040%), Czechoslovakian (97.8%, a difference of 0.040%), and Belgian (97.9%, a difference of 0.050%).
| Demographics | Rating | Rank | 6th Grade |
| Chinese | 100.0 /100 | #35 | Exceptional 97.9% |
| Italians | 100.0 /100 | #36 | Exceptional 97.9% |
| British | 100.0 /100 | #37 | Exceptional 97.9% |
| Belgians | 100.0 /100 | #38 | Exceptional 97.9% |
| Luxembourgers | 99.9 /100 | #39 | Exceptional 97.9% |
| Latvians | 99.9 /100 | #40 | Exceptional 97.9% |
| Eastern Europeans | 99.9 /100 | #41 | Exceptional 97.9% |
| Hungarians | 99.9 /100 | #42 | Exceptional 97.8% |
| Northern Europeans | 99.9 /100 | #43 | Exceptional 97.8% |
| Czechoslovakians | 99.9 /100 | #44 | Exceptional 97.8% |
| Bulgarians | 99.9 /100 | #45 | Exceptional 97.8% |
| Arapaho | 99.9 /100 | #46 | Exceptional 97.8% |
| Native Hawaiians | 99.9 /100 | #47 | Exceptional 97.8% |
| Celtics | 99.9 /100 | #48 | Exceptional 97.8% |
| Estonians | 99.8 /100 | #49 | Exceptional 97.8% |