Immigrants from Micronesia vs Sierra Leonean 10th Grade
COMPARE
Immigrants from Micronesia
Sierra Leonean
10th Grade
10th Grade Comparison
Immigrants from Micronesia
Sierra Leoneans
93.5%
10TH GRADE
23.2/ 100
METRIC RATING
198th/ 347
METRIC RANK
93.7%
10TH GRADE
46.1/ 100
METRIC RATING
178th/ 347
METRIC RANK
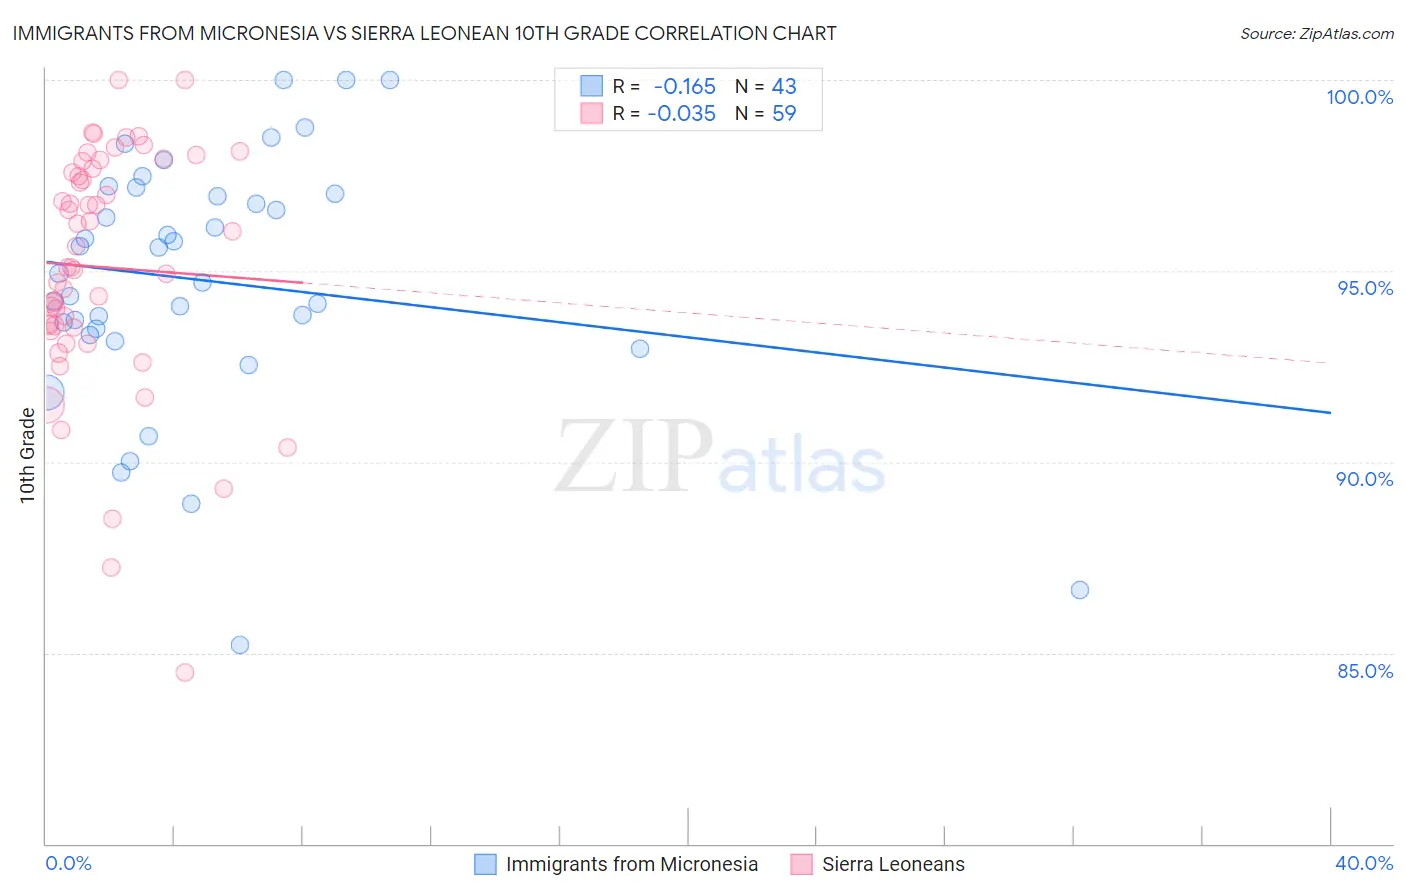
Immigrants from Micronesia vs Sierra Leonean 10th Grade Correlation Chart
The statistical analysis conducted on geographies consisting of 61,604,657 people shows a poor negative correlation between the proportion of Immigrants from Micronesia and percentage of population with at least 10th grade education in the United States with a correlation coefficient (R) of -0.165 and weighted average of 93.5%. Similarly, the statistical analysis conducted on geographies consisting of 83,357,120 people shows no correlation between the proportion of Sierra Leoneans and percentage of population with at least 10th grade education in the United States with a correlation coefficient (R) of -0.035 and weighted average of 93.7%, a difference of 0.23%.
10th Grade Correlation Summary
| Measurement | Immigrants from Micronesia | Sierra Leonean |
| Minimum | 85.2% | 84.5% |
| Maximum | 100.0% | 100.0% |
| Range | 14.8% | 15.5% |
| Mean | 94.7% | 95.1% |
| Median | 94.9% | 95.1% |
| Interquartile 25% (IQ1) | 93.3% | 93.5% |
| Interquartile 75% (IQ3) | 97.0% | 97.7% |
| Interquartile Range (IQR) | 3.7% | 4.2% |
| Standard Deviation (Sample) | 3.3% | 3.2% |
| Standard Deviation (Population) | 3.3% | 3.1% |
Demographics Similar to Immigrants from Micronesia and Sierra Leoneans by 10th Grade
In terms of 10th grade, the demographic groups most similar to Immigrants from Micronesia are Pueblo (93.5%, a difference of 0.010%), Moroccan (93.5%, a difference of 0.030%), Immigrants from Morocco (93.5%, a difference of 0.040%), Cheyenne (93.5%, a difference of 0.040%), and Immigrants from Malaysia (93.5%, a difference of 0.060%). Similarly, the demographic groups most similar to Sierra Leoneans are Paraguayan (93.7%, a difference of 0.010%), Blackfeet (93.7%, a difference of 0.030%), Immigrants from Northern Africa (93.7%, a difference of 0.040%), Colville (93.6%, a difference of 0.070%), and Guamanian/Chamorro (93.6%, a difference of 0.080%).
| Demographics | Rating | Rank | 10th Grade |
| Sierra Leoneans | 46.1 /100 | #178 | Average 93.7% |
| Paraguayans | 45.3 /100 | #179 | Average 93.7% |
| Blackfeet | 42.8 /100 | #180 | Average 93.7% |
| Immigrants | Northern Africa | 41.6 /100 | #181 | Average 93.7% |
| Colville | 38.8 /100 | #182 | Fair 93.6% |
| Guamanians/Chamorros | 37.1 /100 | #183 | Fair 93.6% |
| Choctaw | 36.6 /100 | #184 | Fair 93.6% |
| Sudanese | 36.6 /100 | #185 | Fair 93.6% |
| Immigrants | Eastern Asia | 35.1 /100 | #186 | Fair 93.6% |
| Liberians | 34.7 /100 | #187 | Fair 93.6% |
| Marshallese | 33.2 /100 | #188 | Fair 93.6% |
| Immigrants | Pakistan | 32.5 /100 | #189 | Fair 93.6% |
| Laotians | 32.1 /100 | #190 | Fair 93.6% |
| Yup'ik | 31.1 /100 | #191 | Fair 93.6% |
| Immigrants | Malaysia | 28.0 /100 | #192 | Fair 93.5% |
| Panamanians | 28.0 /100 | #193 | Fair 93.5% |
| Immigrants | Morocco | 26.9 /100 | #194 | Fair 93.5% |
| Cheyenne | 26.8 /100 | #195 | Fair 93.5% |
| Moroccans | 25.3 /100 | #196 | Fair 93.5% |
| Pueblo | 23.9 /100 | #197 | Fair 93.5% |
| Immigrants | Micronesia | 23.2 /100 | #198 | Fair 93.5% |