Immigrants from Micronesia vs Malaysian Bachelor's Degree
COMPARE
Immigrants from Micronesia
Malaysian
Bachelor's Degree
Bachelor's Degree Comparison
Immigrants from Micronesia
Malaysians
30.4%
BACHELOR'S DEGREE
0.0/ 100
METRIC RATING
300th/ 347
METRIC RANK
32.9%
BACHELOR'S DEGREE
0.5/ 100
METRIC RATING
260th/ 347
METRIC RANK
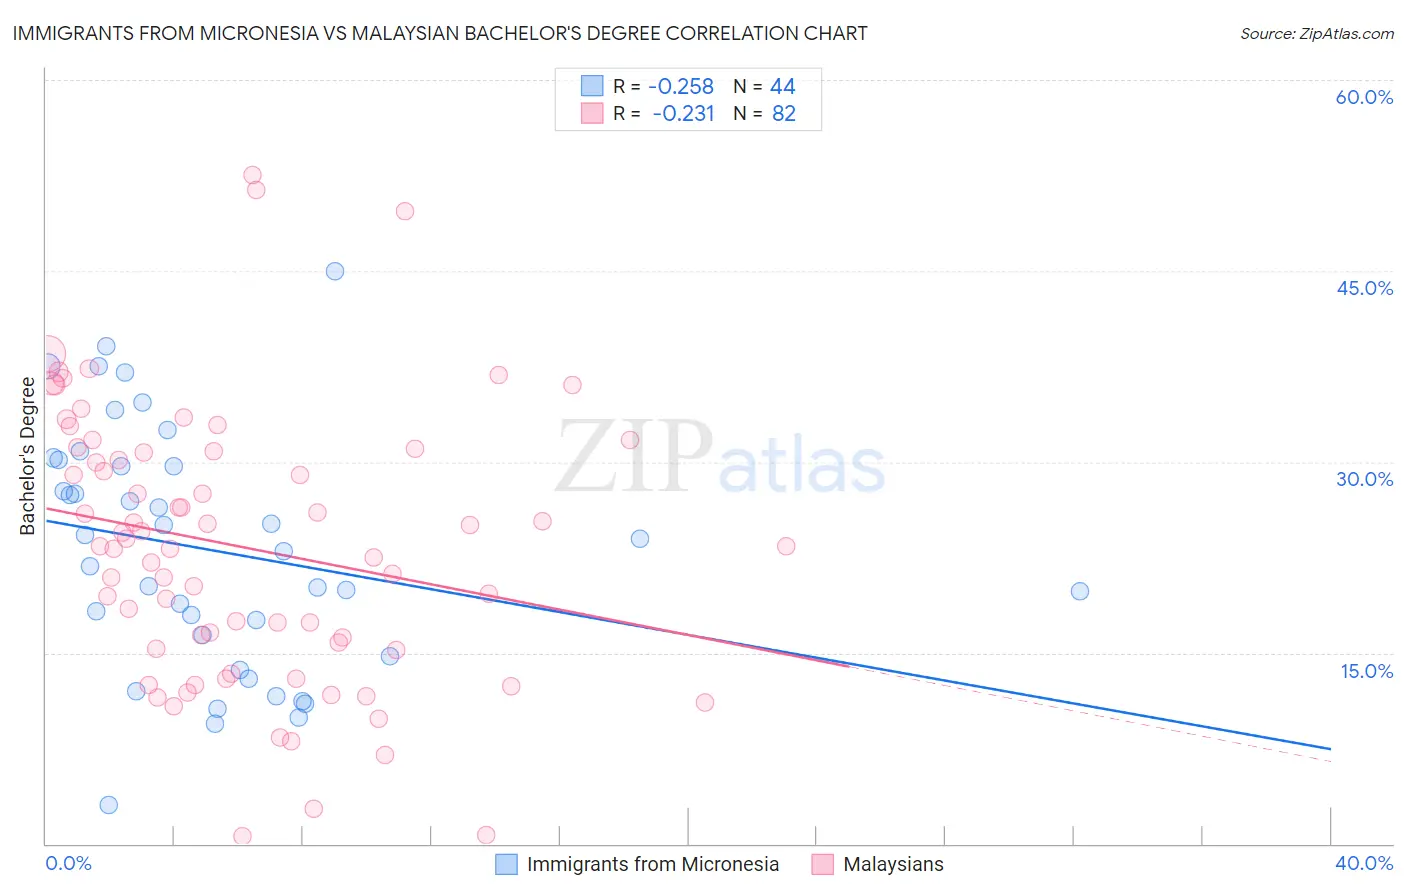
Immigrants from Micronesia vs Malaysian Bachelor's Degree Correlation Chart
The statistical analysis conducted on geographies consisting of 61,608,325 people shows a weak negative correlation between the proportion of Immigrants from Micronesia and percentage of population with at least bachelor's degree education in the United States with a correlation coefficient (R) of -0.258 and weighted average of 30.4%. Similarly, the statistical analysis conducted on geographies consisting of 226,101,467 people shows a weak negative correlation between the proportion of Malaysians and percentage of population with at least bachelor's degree education in the United States with a correlation coefficient (R) of -0.231 and weighted average of 32.9%, a difference of 8.3%.
Bachelor's Degree Correlation Summary
| Measurement | Immigrants from Micronesia | Malaysian |
| Minimum | 3.0% | 0.56% |
| Maximum | 45.0% | 52.5% |
| Range | 42.0% | 51.9% |
| Mean | 23.1% | 23.3% |
| Median | 23.5% | 23.4% |
| Interquartile 25% (IQ1) | 15.6% | 15.3% |
| Interquartile 75% (IQ3) | 29.9% | 30.9% |
| Interquartile Range (IQR) | 14.4% | 15.6% |
| Standard Deviation (Sample) | 9.6% | 10.7% |
| Standard Deviation (Population) | 9.5% | 10.7% |
Similar Demographics by Bachelor's Degree
Demographics Similar to Immigrants from Micronesia by Bachelor's Degree
In terms of bachelor's degree, the demographic groups most similar to Immigrants from Micronesia are Chickasaw (30.4%, a difference of 0.020%), Immigrants from Cuba (30.3%, a difference of 0.22%), Mexican American Indian (30.2%, a difference of 0.49%), Chippewa (30.6%, a difference of 0.54%), and Bangladeshi (30.2%, a difference of 0.66%).
| Demographics | Rating | Rank | Bachelor's Degree |
| Cape Verdeans | 0.1 /100 | #293 | Tragic 30.9% |
| Immigrants | Guatemala | 0.0 /100 | #294 | Tragic 30.8% |
| Immigrants | Dominican Republic | 0.0 /100 | #295 | Tragic 30.7% |
| Puget Sound Salish | 0.0 /100 | #296 | Tragic 30.7% |
| Immigrants | Haiti | 0.0 /100 | #297 | Tragic 30.6% |
| Chippewa | 0.0 /100 | #298 | Tragic 30.6% |
| Chickasaw | 0.0 /100 | #299 | Tragic 30.4% |
| Immigrants | Micronesia | 0.0 /100 | #300 | Tragic 30.4% |
| Immigrants | Cuba | 0.0 /100 | #301 | Tragic 30.3% |
| Mexican American Indians | 0.0 /100 | #302 | Tragic 30.2% |
| Bangladeshis | 0.0 /100 | #303 | Tragic 30.2% |
| Cherokee | 0.0 /100 | #304 | Tragic 30.2% |
| Immigrants | Latin America | 0.0 /100 | #305 | Tragic 30.1% |
| Immigrants | Yemen | 0.0 /100 | #306 | Tragic 29.9% |
| Nepalese | 0.0 /100 | #307 | Tragic 29.9% |
Demographics Similar to Malaysians by Bachelor's Degree
In terms of bachelor's degree, the demographic groups most similar to Malaysians are African (32.9%, a difference of 0.090%), Immigrants from Jamaica (32.9%, a difference of 0.090%), Osage (33.0%, a difference of 0.36%), Belizean (32.8%, a difference of 0.38%), and French American Indian (33.1%, a difference of 0.41%).
| Demographics | Rating | Rank | Bachelor's Degree |
| U.S. Virgin Islanders | 0.7 /100 | #253 | Tragic 33.2% |
| Native Hawaiians | 0.7 /100 | #254 | Tragic 33.2% |
| Iroquois | 0.7 /100 | #255 | Tragic 33.2% |
| Nicaraguans | 0.6 /100 | #256 | Tragic 33.1% |
| Spanish Americans | 0.6 /100 | #257 | Tragic 33.1% |
| French American Indians | 0.6 /100 | #258 | Tragic 33.1% |
| Osage | 0.5 /100 | #259 | Tragic 33.0% |
| Malaysians | 0.5 /100 | #260 | Tragic 32.9% |
| Africans | 0.5 /100 | #261 | Tragic 32.9% |
| Immigrants | Jamaica | 0.5 /100 | #262 | Tragic 32.9% |
| Belizeans | 0.4 /100 | #263 | Tragic 32.8% |
| Central American Indians | 0.3 /100 | #264 | Tragic 32.5% |
| Bahamians | 0.3 /100 | #265 | Tragic 32.5% |
| Immigrants | Dominica | 0.3 /100 | #266 | Tragic 32.5% |
| Cubans | 0.3 /100 | #267 | Tragic 32.5% |