Immigrants from Micronesia vs Immigrants from Kazakhstan 11th Grade
COMPARE
Immigrants from Micronesia
Immigrants from Kazakhstan
11th Grade
11th Grade Comparison
Immigrants from Micronesia
Immigrants from Kazakhstan
92.2%
11TH GRADE
17.7/ 100
METRIC RATING
211th/ 347
METRIC RANK
93.1%
11TH GRADE
92.4/ 100
METRIC RATING
127th/ 347
METRIC RANK
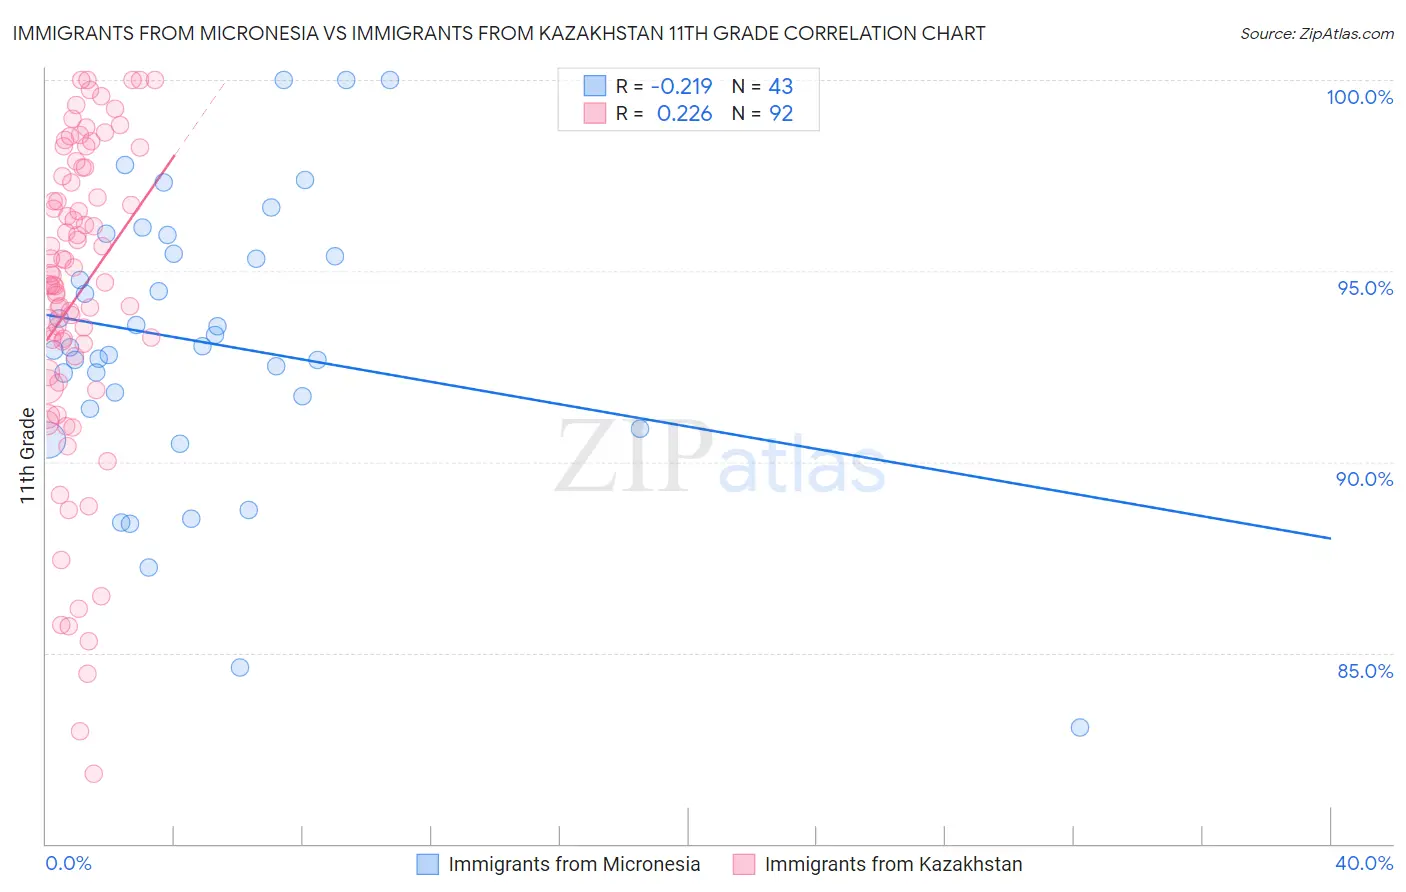
Immigrants from Micronesia vs Immigrants from Kazakhstan 11th Grade Correlation Chart
The statistical analysis conducted on geographies consisting of 61,604,657 people shows a weak negative correlation between the proportion of Immigrants from Micronesia and percentage of population with at least 11th grade education in the United States with a correlation coefficient (R) of -0.219 and weighted average of 92.2%. Similarly, the statistical analysis conducted on geographies consisting of 124,444,172 people shows a weak positive correlation between the proportion of Immigrants from Kazakhstan and percentage of population with at least 11th grade education in the United States with a correlation coefficient (R) of 0.226 and weighted average of 93.1%, a difference of 1.0%.
11th Grade Correlation Summary
| Measurement | Immigrants from Micronesia | Immigrants from Kazakhstan |
| Minimum | 83.0% | 81.8% |
| Maximum | 100.0% | 100.0% |
| Range | 17.0% | 18.2% |
| Mean | 93.1% | 94.4% |
| Median | 93.0% | 94.8% |
| Interquartile 25% (IQ1) | 91.4% | 92.6% |
| Interquartile 75% (IQ3) | 95.5% | 97.6% |
| Interquartile Range (IQR) | 4.1% | 5.0% |
| Standard Deviation (Sample) | 3.7% | 4.2% |
| Standard Deviation (Population) | 3.7% | 4.1% |
Similar Demographics by 11th Grade
Demographics Similar to Immigrants from Micronesia by 11th Grade
In terms of 11th grade, the demographic groups most similar to Immigrants from Micronesia are Ethiopian (92.2%, a difference of 0.020%), Tongan (92.2%, a difference of 0.030%), Colville (92.2%, a difference of 0.060%), Korean (92.1%, a difference of 0.060%), and Immigrants from Oceania (92.2%, a difference of 0.070%).
| Demographics | Rating | Rank | 11th Grade |
| Immigrants | Hong Kong | 23.3 /100 | #204 | Fair 92.2% |
| Kiowa | 23.2 /100 | #205 | Fair 92.2% |
| Bolivians | 23.2 /100 | #206 | Fair 92.2% |
| Immigrants | Oceania | 22.4 /100 | #207 | Fair 92.2% |
| Colville | 21.8 /100 | #208 | Fair 92.2% |
| Tongans | 19.8 /100 | #209 | Poor 92.2% |
| Ethiopians | 18.8 /100 | #210 | Poor 92.2% |
| Immigrants | Micronesia | 17.7 /100 | #211 | Poor 92.2% |
| Koreans | 14.4 /100 | #212 | Poor 92.1% |
| Immigrants | Ethiopia | 13.9 /100 | #213 | Poor 92.1% |
| Afghans | 12.8 /100 | #214 | Poor 92.1% |
| Immigrants | Southern Europe | 12.5 /100 | #215 | Poor 92.1% |
| Somalis | 11.6 /100 | #216 | Poor 92.1% |
| Immigrants | Sierra Leone | 11.1 /100 | #217 | Poor 92.0% |
| Blackfeet | 10.1 /100 | #218 | Poor 92.0% |
Demographics Similar to Immigrants from Kazakhstan by 11th Grade
In terms of 11th grade, the demographic groups most similar to Immigrants from Kazakhstan are Immigrants from Jordan (93.1%, a difference of 0.0%), Immigrants from Ukraine (93.0%, a difference of 0.080%), Albanian (93.0%, a difference of 0.090%), Egyptian (93.0%, a difference of 0.090%), and Immigrants from Bosnia and Herzegovina (93.0%, a difference of 0.10%).
| Demographics | Rating | Rank | 11th Grade |
| Immigrants | Russia | 96.6 /100 | #120 | Exceptional 93.3% |
| German Russians | 96.4 /100 | #121 | Exceptional 93.3% |
| Immigrants | Belarus | 96.3 /100 | #122 | Exceptional 93.3% |
| Immigrants | Greece | 95.9 /100 | #123 | Exceptional 93.2% |
| Immigrants | Eastern Europe | 95.9 /100 | #124 | Exceptional 93.2% |
| Immigrants | Sri Lanka | 95.6 /100 | #125 | Exceptional 93.2% |
| Basques | 95.2 /100 | #126 | Exceptional 93.2% |
| Immigrants | Kazakhstan | 92.4 /100 | #127 | Exceptional 93.1% |
| Immigrants | Jordan | 92.4 /100 | #128 | Exceptional 93.1% |
| Immigrants | Ukraine | 89.8 /100 | #129 | Excellent 93.0% |
| Albanians | 89.5 /100 | #130 | Excellent 93.0% |
| Egyptians | 89.5 /100 | #131 | Excellent 93.0% |
| Immigrants | Bosnia and Herzegovina | 89.0 /100 | #132 | Excellent 93.0% |
| Mongolians | 87.6 /100 | #133 | Excellent 93.0% |
| Delaware | 87.3 /100 | #134 | Excellent 93.0% |