Immigrants from Micronesia vs Apache No Schooling Completed
COMPARE
Immigrants from Micronesia
Apache
No Schooling Completed
No Schooling Completed Comparison
Immigrants from Micronesia
Apache
2.1%
NO SCHOOLING COMPLETED
50.0/ 100
METRIC RATING
174th/ 347
METRIC RANK
2.1%
NO SCHOOLING COMPLETED
56.7/ 100
METRIC RATING
169th/ 347
METRIC RANK
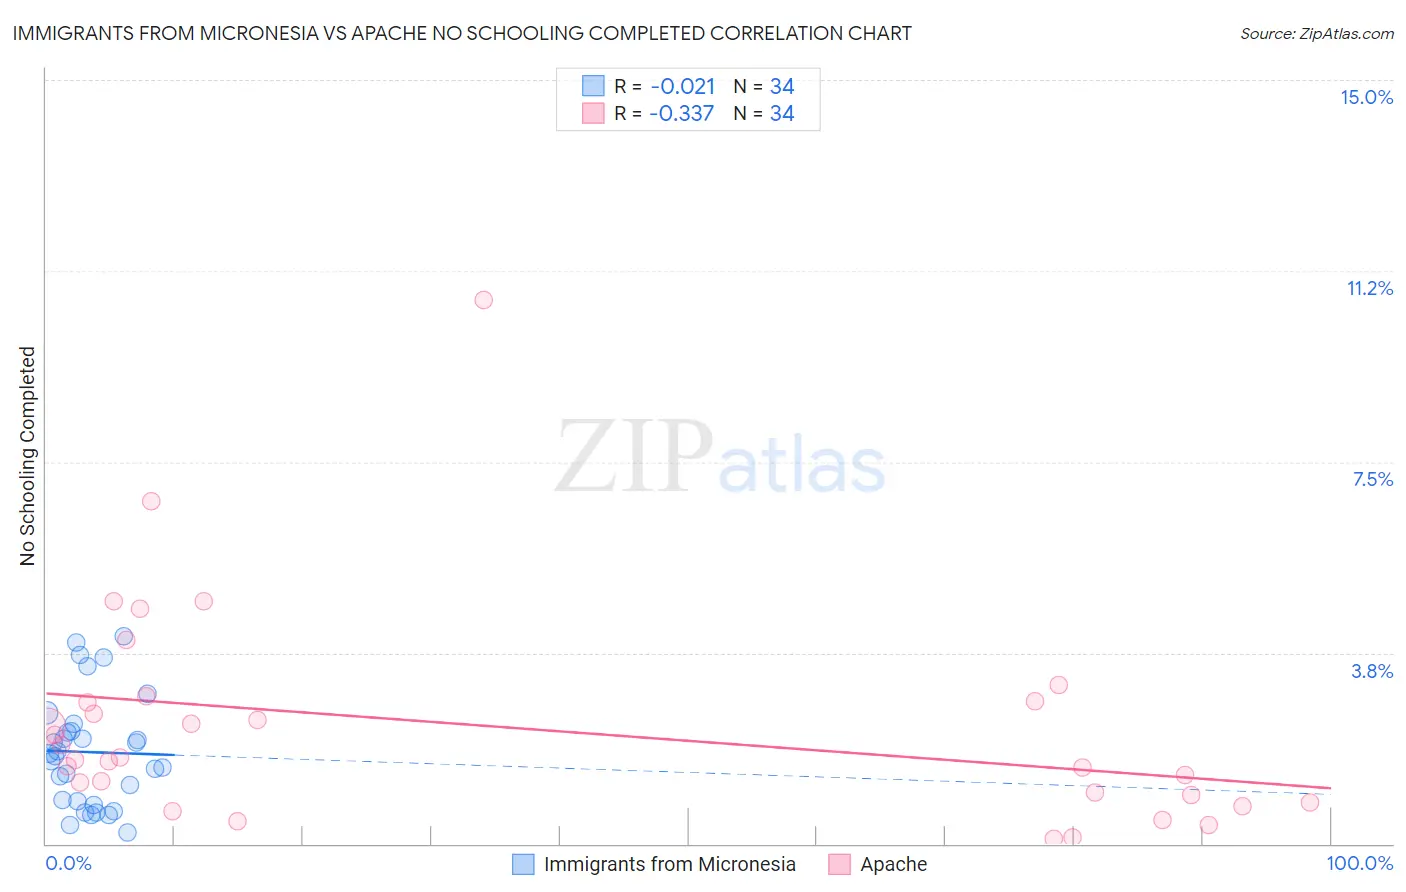
Immigrants from Micronesia vs Apache No Schooling Completed Correlation Chart
The statistical analysis conducted on geographies consisting of 61,387,395 people shows no correlation between the proportion of Immigrants from Micronesia and percentage of population with no schooling in the United States with a correlation coefficient (R) of -0.021 and weighted average of 2.1%. Similarly, the statistical analysis conducted on geographies consisting of 229,858,613 people shows a mild negative correlation between the proportion of Apache and percentage of population with no schooling in the United States with a correlation coefficient (R) of -0.337 and weighted average of 2.1%, a difference of 0.91%.
No Schooling Completed Correlation Summary
| Measurement | Immigrants from Micronesia | Apache |
| Minimum | 0.23% | 0.098% |
| Maximum | 4.1% | 10.7% |
| Range | 3.9% | 10.6% |
| Mean | 1.8% | 2.3% |
| Median | 1.7% | 1.7% |
| Interquartile 25% (IQ1) | 0.84% | 0.95% |
| Interquartile 75% (IQ3) | 2.2% | 2.8% |
| Interquartile Range (IQR) | 1.4% | 1.9% |
| Standard Deviation (Sample) | 1.1% | 2.1% |
| Standard Deviation (Population) | 1.1% | 2.1% |
Demographics Similar to Immigrants from Micronesia and Apache by No Schooling Completed
In terms of no schooling completed, the demographic groups most similar to Immigrants from Micronesia are Immigrants from Belarus (2.1%, a difference of 0.24%), Immigrants from Argentina (2.1%, a difference of 0.37%), Arab (2.1%, a difference of 0.48%), Panamanian (2.1%, a difference of 0.65%), and Arapaho (2.1%, a difference of 0.67%). Similarly, the demographic groups most similar to Apache are Argentinean (2.1%, a difference of 0.090%), Immigrants from Poland (2.1%, a difference of 0.20%), Cheyenne (2.1%, a difference of 0.27%), Egyptian (2.1%, a difference of 0.35%), and Dutch West Indian (2.1%, a difference of 0.46%).
| Demographics | Rating | Rank | No Schooling Completed |
| Ugandans | 64.6 /100 | #161 | Good 2.0% |
| Immigrants | Brazil | 63.8 /100 | #162 | Good 2.1% |
| Albanians | 62.2 /100 | #163 | Good 2.1% |
| Comanche | 60.7 /100 | #164 | Good 2.1% |
| Brazilians | 60.2 /100 | #165 | Good 2.1% |
| Dutch West Indians | 59.9 /100 | #166 | Average 2.1% |
| Egyptians | 59.2 /100 | #167 | Average 2.1% |
| Cheyenne | 58.6 /100 | #168 | Average 2.1% |
| Apache | 56.7 /100 | #169 | Average 2.1% |
| Argentineans | 56.0 /100 | #170 | Average 2.1% |
| Immigrants | Poland | 55.2 /100 | #171 | Average 2.1% |
| Immigrants | Argentina | 52.7 /100 | #172 | Average 2.1% |
| Immigrants | Belarus | 51.8 /100 | #173 | Average 2.1% |
| Immigrants | Micronesia | 50.0 /100 | #174 | Average 2.1% |
| Arabs | 46.4 /100 | #175 | Average 2.1% |
| Panamanians | 45.2 /100 | #176 | Average 2.1% |
| Arapaho | 45.0 /100 | #177 | Average 2.1% |
| Pakistanis | 44.7 /100 | #178 | Average 2.1% |
| Immigrants | Kazakhstan | 44.3 /100 | #179 | Average 2.1% |
| Portuguese | 43.9 /100 | #180 | Average 2.1% |
| Immigrants | Taiwan | 42.6 /100 | #181 | Average 2.1% |