Immigrants from Malaysia vs Yup'ik 5th Grade
COMPARE
Immigrants from Malaysia
Yup'ik
5th Grade
5th Grade Comparison
Immigrants from Malaysia
Yup'ik
97.0%
5TH GRADE
4.1/ 100
METRIC RATING
231st/ 347
METRIC RANK
98.2%
5TH GRADE
100.0/ 100
METRIC RATING
25th/ 347
METRIC RANK
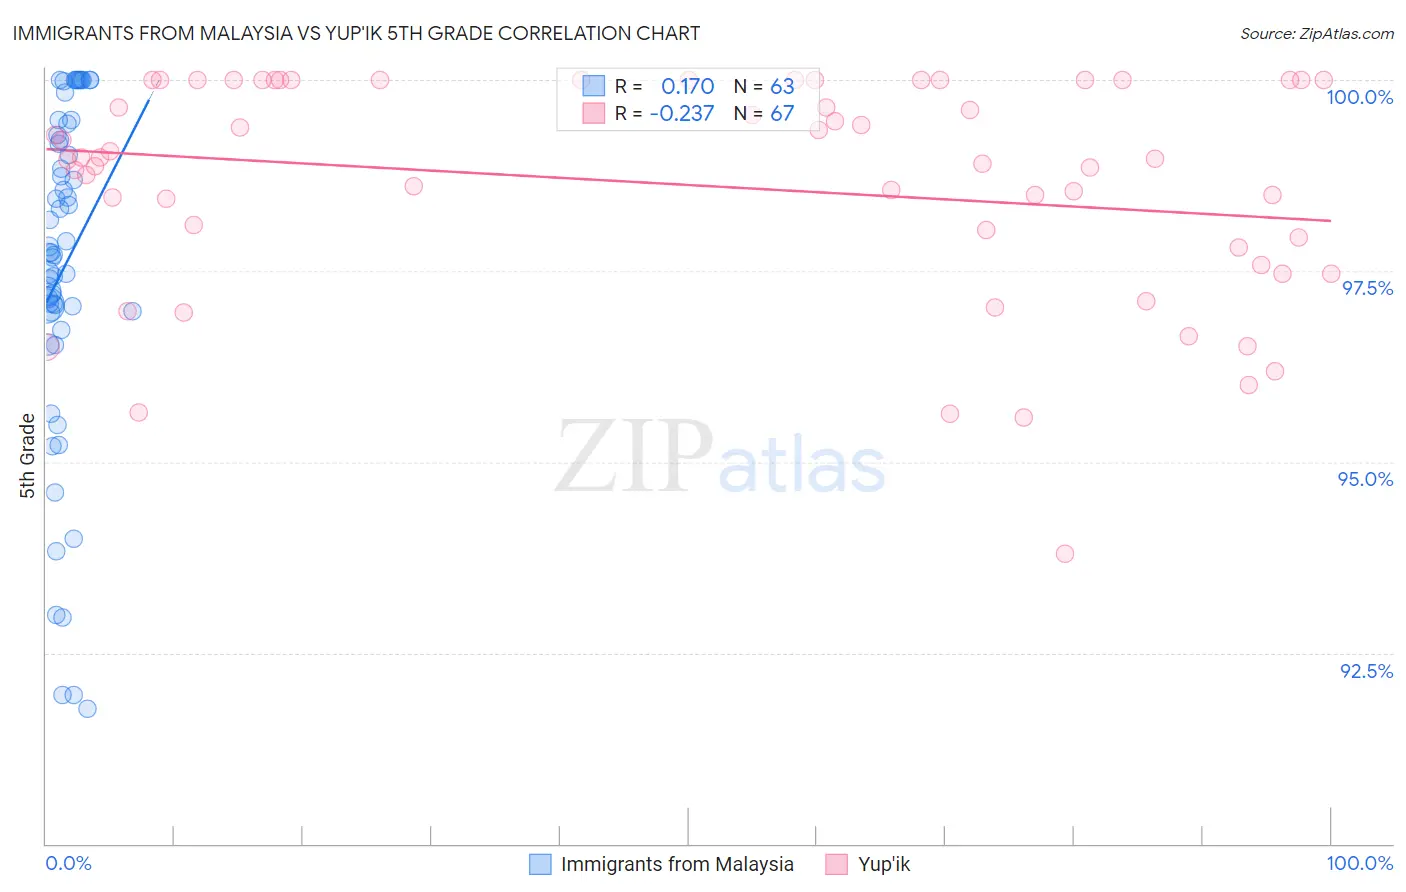
Immigrants from Malaysia vs Yup'ik 5th Grade Correlation Chart
The statistical analysis conducted on geographies consisting of 197,973,709 people shows a poor positive correlation between the proportion of Immigrants from Malaysia and percentage of population with at least 5th grade education in the United States with a correlation coefficient (R) of 0.170 and weighted average of 97.0%. Similarly, the statistical analysis conducted on geographies consisting of 39,964,464 people shows a weak negative correlation between the proportion of Yup'ik and percentage of population with at least 5th grade education in the United States with a correlation coefficient (R) of -0.237 and weighted average of 98.2%, a difference of 1.2%.
5th Grade Correlation Summary
| Measurement | Immigrants from Malaysia | Yup'ik |
| Minimum | 91.8% | 93.8% |
| Maximum | 100.0% | 100.0% |
| Range | 8.2% | 6.2% |
| Mean | 97.5% | 98.6% |
| Median | 97.7% | 99.0% |
| Interquartile 25% (IQ1) | 97.0% | 97.8% |
| Interquartile 75% (IQ3) | 99.3% | 100.0% |
| Interquartile Range (IQR) | 2.3% | 2.2% |
| Standard Deviation (Sample) | 2.2% | 1.4% |
| Standard Deviation (Population) | 2.2% | 1.4% |
Similar Demographics by 5th Grade
Demographics Similar to Immigrants from Malaysia by 5th Grade
In terms of 5th grade, the demographic groups most similar to Immigrants from Malaysia are Immigrants from Eastern Asia (97.0%, a difference of 0.0%), Immigrants from Pakistan (97.0%, a difference of 0.010%), Assyrian/Chaldean/Syriac (97.0%, a difference of 0.010%), Yuman (97.0%, a difference of 0.010%), and Immigrants from Western Asia (97.0%, a difference of 0.010%).
| Demographics | Rating | Rank | 5th Grade |
| South American Indians | 5.4 /100 | #224 | Tragic 97.0% |
| Bahamians | 5.3 /100 | #225 | Tragic 97.0% |
| Tongans | 5.3 /100 | #226 | Tragic 97.0% |
| Immigrants | Pakistan | 4.7 /100 | #227 | Tragic 97.0% |
| Assyrians/Chaldeans/Syriacs | 4.5 /100 | #228 | Tragic 97.0% |
| Yuman | 4.5 /100 | #229 | Tragic 97.0% |
| Immigrants | Western Asia | 4.3 /100 | #230 | Tragic 97.0% |
| Immigrants | Malaysia | 4.1 /100 | #231 | Tragic 97.0% |
| Immigrants | Eastern Asia | 4.0 /100 | #232 | Tragic 97.0% |
| Sub-Saharan Africans | 3.3 /100 | #233 | Tragic 97.0% |
| Tohono O'odham | 3.2 /100 | #234 | Tragic 97.0% |
| Uruguayans | 3.2 /100 | #235 | Tragic 97.0% |
| Senegalese | 2.8 /100 | #236 | Tragic 97.0% |
| Immigrants | Indonesia | 2.0 /100 | #237 | Tragic 96.9% |
| Asians | 2.0 /100 | #238 | Tragic 96.9% |
Demographics Similar to Yup'ik by 5th Grade
In terms of 5th grade, the demographic groups most similar to Yup'ik are Alaska Native (98.2%, a difference of 0.0%), Croatian (98.2%, a difference of 0.010%), Sioux (98.2%, a difference of 0.010%), Scotch-Irish (98.2%, a difference of 0.010%), and French (98.2%, a difference of 0.010%).
| Demographics | Rating | Rank | 5th Grade |
| Pennsylvania Germans | 100.0 /100 | #18 | Exceptional 98.3% |
| Finns | 100.0 /100 | #19 | Exceptional 98.2% |
| Lithuanians | 100.0 /100 | #20 | Exceptional 98.2% |
| Danes | 100.0 /100 | #21 | Exceptional 98.2% |
| Croatians | 100.0 /100 | #22 | Exceptional 98.2% |
| Sioux | 100.0 /100 | #23 | Exceptional 98.2% |
| Scotch-Irish | 100.0 /100 | #24 | Exceptional 98.2% |
| Yup'ik | 100.0 /100 | #25 | Exceptional 98.2% |
| Alaska Natives | 100.0 /100 | #26 | Exceptional 98.2% |
| French | 100.0 /100 | #27 | Exceptional 98.2% |
| Czechs | 100.0 /100 | #28 | Exceptional 98.2% |
| Scandinavians | 100.0 /100 | #29 | Exceptional 98.2% |
| French Canadians | 100.0 /100 | #30 | Exceptional 98.2% |
| Europeans | 100.0 /100 | #31 | Exceptional 98.2% |
| Chippewa | 100.0 /100 | #32 | Exceptional 98.1% |