Immigrants from Malaysia vs Nicaraguan Bachelor's Degree
COMPARE
Immigrants from Malaysia
Nicaraguan
Bachelor's Degree
Bachelor's Degree Comparison
Immigrants from Malaysia
Nicaraguans
45.0%
BACHELOR'S DEGREE
100.0/ 100
METRIC RATING
41st/ 347
METRIC RANK
33.1%
BACHELOR'S DEGREE
0.6/ 100
METRIC RATING
256th/ 347
METRIC RANK
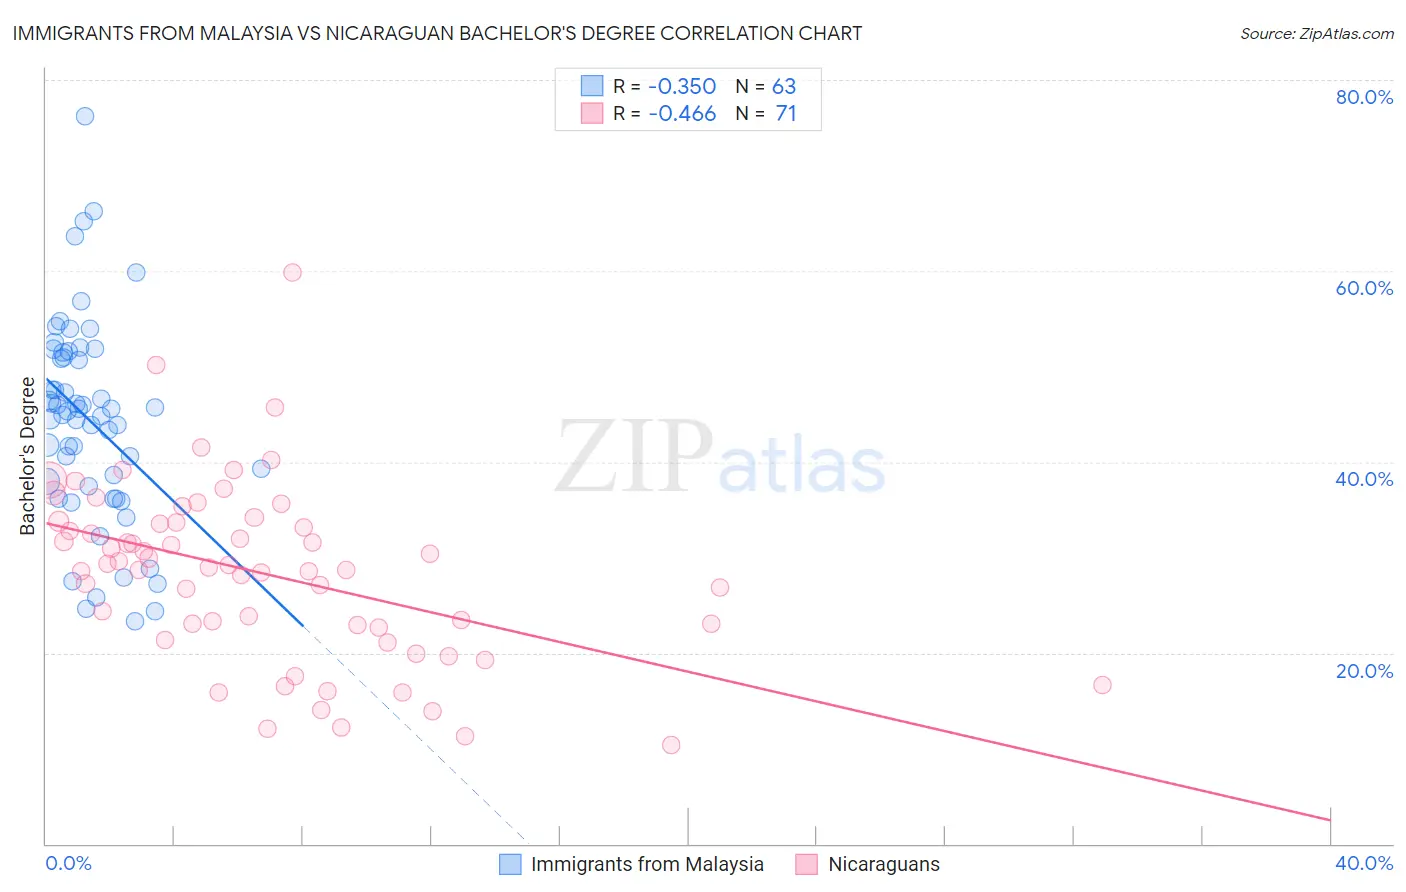
Immigrants from Malaysia vs Nicaraguan Bachelor's Degree Correlation Chart
The statistical analysis conducted on geographies consisting of 197,964,670 people shows a mild negative correlation between the proportion of Immigrants from Malaysia and percentage of population with at least bachelor's degree education in the United States with a correlation coefficient (R) of -0.350 and weighted average of 45.0%. Similarly, the statistical analysis conducted on geographies consisting of 285,704,287 people shows a moderate negative correlation between the proportion of Nicaraguans and percentage of population with at least bachelor's degree education in the United States with a correlation coefficient (R) of -0.466 and weighted average of 33.1%, a difference of 35.8%.
Bachelor's Degree Correlation Summary
| Measurement | Immigrants from Malaysia | Nicaraguan |
| Minimum | 23.2% | 10.4% |
| Maximum | 76.2% | 59.8% |
| Range | 53.0% | 49.4% |
| Mean | 44.4% | 28.3% |
| Median | 45.3% | 29.0% |
| Interquartile 25% (IQ1) | 37.4% | 22.7% |
| Interquartile 75% (IQ3) | 51.4% | 33.7% |
| Interquartile Range (IQR) | 14.1% | 11.0% |
| Standard Deviation (Sample) | 10.7% | 9.3% |
| Standard Deviation (Population) | 10.6% | 9.3% |
Similar Demographics by Bachelor's Degree
Demographics Similar to Immigrants from Malaysia by Bachelor's Degree
In terms of bachelor's degree, the demographic groups most similar to Immigrants from Malaysia are Immigrants from Belarus (45.0%, a difference of 0.040%), Immigrants from Latvia (45.1%, a difference of 0.31%), Immigrants from Saudi Arabia (44.8%, a difference of 0.38%), Immigrants from South Africa (44.8%, a difference of 0.52%), and Bulgarian (45.3%, a difference of 0.64%).
| Demographics | Rating | Rank | Bachelor's Degree |
| Immigrants | Denmark | 100.0 /100 | #34 | Exceptional 45.4% |
| Immigrants | Russia | 100.0 /100 | #35 | Exceptional 45.4% |
| Mongolians | 100.0 /100 | #36 | Exceptional 45.4% |
| Russians | 100.0 /100 | #37 | Exceptional 45.3% |
| Bulgarians | 100.0 /100 | #38 | Exceptional 45.3% |
| Immigrants | Latvia | 100.0 /100 | #39 | Exceptional 45.1% |
| Immigrants | Belarus | 100.0 /100 | #40 | Exceptional 45.0% |
| Immigrants | Malaysia | 100.0 /100 | #41 | Exceptional 45.0% |
| Immigrants | Saudi Arabia | 100.0 /100 | #42 | Exceptional 44.8% |
| Immigrants | South Africa | 99.9 /100 | #43 | Exceptional 44.8% |
| Immigrants | Lithuania | 99.9 /100 | #44 | Exceptional 44.6% |
| Immigrants | Kuwait | 99.9 /100 | #45 | Exceptional 44.6% |
| Immigrants | Bulgaria | 99.9 /100 | #46 | Exceptional 44.6% |
| Bolivians | 99.9 /100 | #47 | Exceptional 44.6% |
| Estonians | 99.9 /100 | #48 | Exceptional 44.6% |
Demographics Similar to Nicaraguans by Bachelor's Degree
In terms of bachelor's degree, the demographic groups most similar to Nicaraguans are Iroquois (33.2%, a difference of 0.19%), Native Hawaiian (33.2%, a difference of 0.20%), Spanish American (33.1%, a difference of 0.22%), French American Indian (33.1%, a difference of 0.26%), and U.S. Virgin Islander (33.2%, a difference of 0.27%).
| Demographics | Rating | Rank | Bachelor's Degree |
| Immigrants | Liberia | 0.9 /100 | #249 | Tragic 33.5% |
| Indonesians | 0.9 /100 | #250 | Tragic 33.5% |
| Japanese | 0.7 /100 | #251 | Tragic 33.3% |
| Immigrants | Bahamas | 0.7 /100 | #252 | Tragic 33.3% |
| U.S. Virgin Islanders | 0.7 /100 | #253 | Tragic 33.2% |
| Native Hawaiians | 0.7 /100 | #254 | Tragic 33.2% |
| Iroquois | 0.7 /100 | #255 | Tragic 33.2% |
| Nicaraguans | 0.6 /100 | #256 | Tragic 33.1% |
| Spanish Americans | 0.6 /100 | #257 | Tragic 33.1% |
| French American Indians | 0.6 /100 | #258 | Tragic 33.1% |
| Osage | 0.5 /100 | #259 | Tragic 33.0% |
| Malaysians | 0.5 /100 | #260 | Tragic 32.9% |
| Africans | 0.5 /100 | #261 | Tragic 32.9% |
| Immigrants | Jamaica | 0.5 /100 | #262 | Tragic 32.9% |
| Belizeans | 0.4 /100 | #263 | Tragic 32.8% |