Immigrants from Malaysia vs Hopi College, 1 year or more
COMPARE
Immigrants from Malaysia
Hopi
College, 1 year or more
College, 1 year or more Comparison
Immigrants from Malaysia
Hopi
64.3%
COLLEGE, 1 YEAR OR MORE
99.8/ 100
METRIC RATING
51st/ 347
METRIC RANK
50.9%
COLLEGE, 1 YEAR OR MORE
0.0/ 100
METRIC RATING
321st/ 347
METRIC RANK
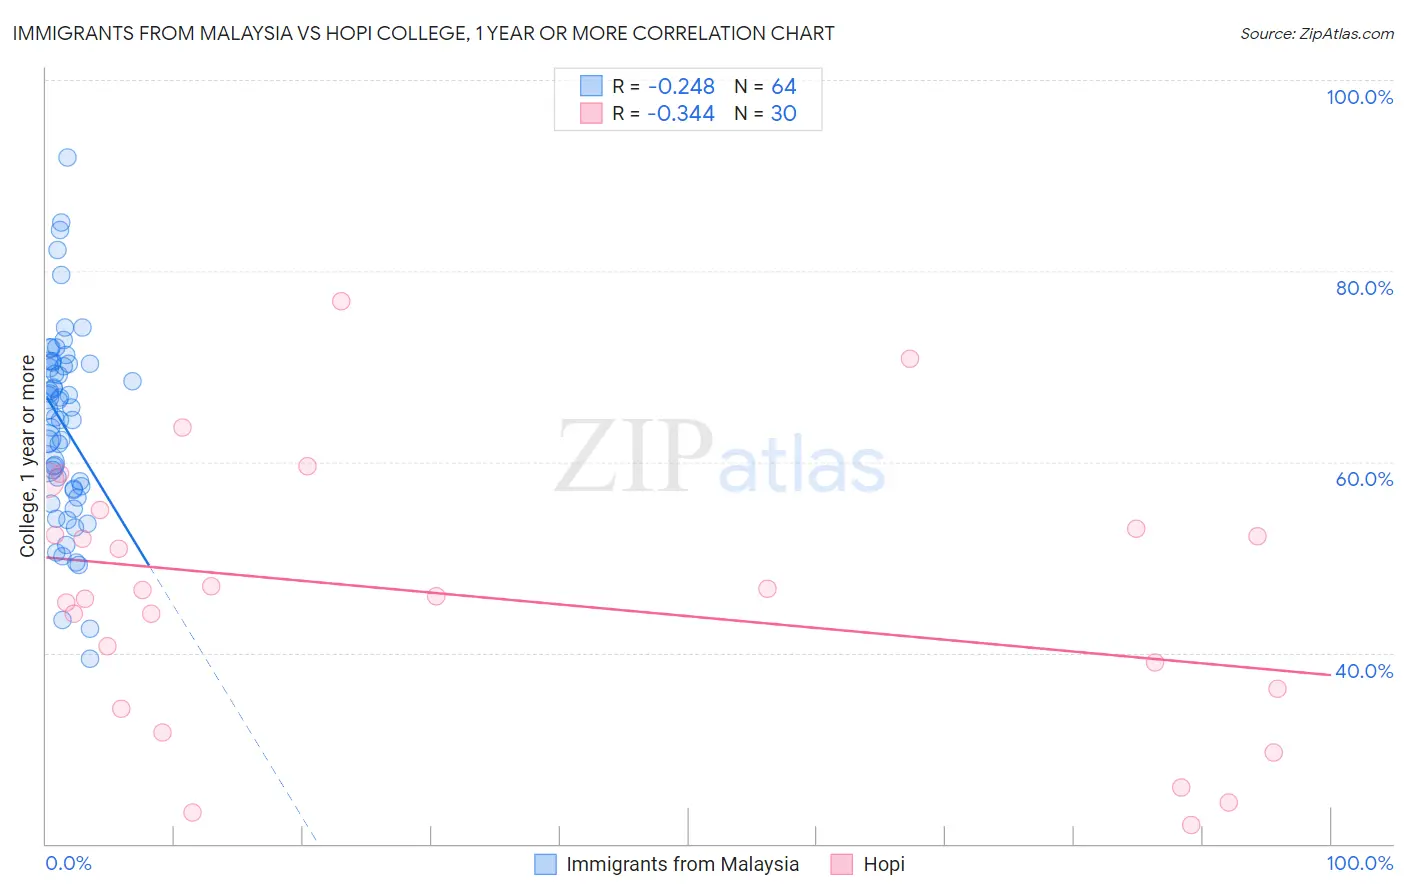
Immigrants from Malaysia vs Hopi College, 1 year or more Correlation Chart
The statistical analysis conducted on geographies consisting of 197,973,854 people shows a weak negative correlation between the proportion of Immigrants from Malaysia and percentage of population with at least college, 1 year or more education in the United States with a correlation coefficient (R) of -0.248 and weighted average of 64.3%. Similarly, the statistical analysis conducted on geographies consisting of 74,740,168 people shows a mild negative correlation between the proportion of Hopi and percentage of population with at least college, 1 year or more education in the United States with a correlation coefficient (R) of -0.344 and weighted average of 50.9%, a difference of 26.4%.
College, 1 year or more Correlation Summary
| Measurement | Immigrants from Malaysia | Hopi |
| Minimum | 39.4% | 21.9% |
| Maximum | 91.9% | 76.9% |
| Range | 52.5% | 55.0% |
| Mean | 63.9% | 45.8% |
| Median | 65.1% | 46.2% |
| Interquartile 25% (IQ1) | 57.1% | 36.2% |
| Interquartile 75% (IQ3) | 70.3% | 53.0% |
| Interquartile Range (IQR) | 13.1% | 16.9% |
| Standard Deviation (Sample) | 10.2% | 13.7% |
| Standard Deviation (Population) | 10.1% | 13.4% |
Similar Demographics by College, 1 year or more
Demographics Similar to Immigrants from Malaysia by College, 1 year or more
In terms of college, 1 year or more, the demographic groups most similar to Immigrants from Malaysia are Immigrants from Austria (64.4%, a difference of 0.080%), Immigrants from Netherlands (64.2%, a difference of 0.16%), Asian (64.2%, a difference of 0.18%), Zimbabwean (64.2%, a difference of 0.21%), and Immigrants from Belarus (64.1%, a difference of 0.33%).
| Demographics | Rating | Rank | College, 1 year or more |
| Immigrants | Norway | 99.9 /100 | #44 | Exceptional 64.7% |
| Immigrants | Lithuania | 99.9 /100 | #45 | Exceptional 64.6% |
| Bhutanese | 99.9 /100 | #46 | Exceptional 64.6% |
| Australians | 99.9 /100 | #47 | Exceptional 64.6% |
| Immigrants | Bulgaria | 99.9 /100 | #48 | Exceptional 64.6% |
| New Zealanders | 99.9 /100 | #49 | Exceptional 64.6% |
| Immigrants | Austria | 99.8 /100 | #50 | Exceptional 64.4% |
| Immigrants | Malaysia | 99.8 /100 | #51 | Exceptional 64.3% |
| Immigrants | Netherlands | 99.8 /100 | #52 | Exceptional 64.2% |
| Asians | 99.8 /100 | #53 | Exceptional 64.2% |
| Zimbabweans | 99.8 /100 | #54 | Exceptional 64.2% |
| Immigrants | Belarus | 99.7 /100 | #55 | Exceptional 64.1% |
| Immigrants | Czechoslovakia | 99.7 /100 | #56 | Exceptional 64.1% |
| South Africans | 99.7 /100 | #57 | Exceptional 64.1% |
| Immigrants | Asia | 99.7 /100 | #58 | Exceptional 64.0% |
Demographics Similar to Hopi by College, 1 year or more
In terms of college, 1 year or more, the demographic groups most similar to Hopi are Kiowa (51.0%, a difference of 0.12%), Navajo (50.8%, a difference of 0.18%), Immigrants from El Salvador (51.0%, a difference of 0.19%), Immigrants from Honduras (51.0%, a difference of 0.27%), and Hispanic or Latino (51.1%, a difference of 0.40%).
| Demographics | Rating | Rank | College, 1 year or more |
| Fijians | 0.0 /100 | #314 | Tragic 51.3% |
| Guatemalans | 0.0 /100 | #315 | Tragic 51.2% |
| Cajuns | 0.0 /100 | #316 | Tragic 51.2% |
| Hispanics or Latinos | 0.0 /100 | #317 | Tragic 51.1% |
| Immigrants | Honduras | 0.0 /100 | #318 | Tragic 51.0% |
| Immigrants | El Salvador | 0.0 /100 | #319 | Tragic 51.0% |
| Kiowa | 0.0 /100 | #320 | Tragic 51.0% |
| Hopi | 0.0 /100 | #321 | Tragic 50.9% |
| Navajo | 0.0 /100 | #322 | Tragic 50.8% |
| Immigrants | Guatemala | 0.0 /100 | #323 | Tragic 50.7% |
| Immigrants | Cuba | 0.0 /100 | #324 | Tragic 50.7% |
| Immigrants | Latin America | 0.0 /100 | #325 | Tragic 50.7% |
| Dominicans | 0.0 /100 | #326 | Tragic 50.6% |
| Menominee | 0.0 /100 | #327 | Tragic 50.6% |
| Dutch West Indians | 0.0 /100 | #328 | Tragic 50.5% |