Immigrants from Lithuania vs Yuman 6th Grade
COMPARE
Immigrants from Lithuania
Yuman
6th Grade
6th Grade Comparison
Immigrants from Lithuania
Yuman
97.6%
6TH GRADE
99.3/ 100
METRIC RATING
77th/ 347
METRIC RANK
96.7%
6TH GRADE
3.2/ 100
METRIC RATING
233rd/ 347
METRIC RANK
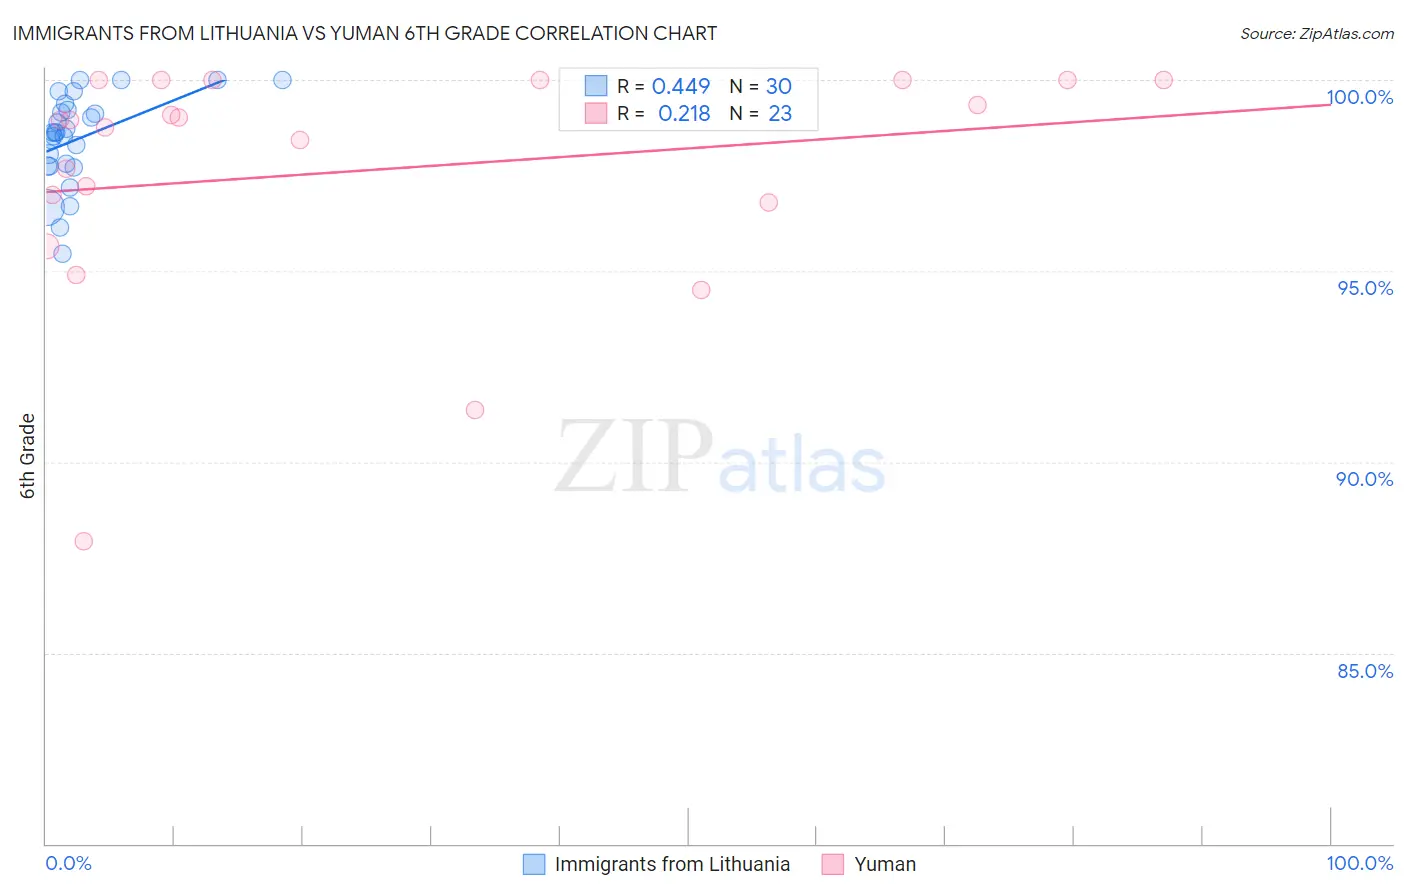
Immigrants from Lithuania vs Yuman 6th Grade Correlation Chart
The statistical analysis conducted on geographies consisting of 117,724,932 people shows a moderate positive correlation between the proportion of Immigrants from Lithuania and percentage of population with at least 6th grade education in the United States with a correlation coefficient (R) of 0.449 and weighted average of 97.6%. Similarly, the statistical analysis conducted on geographies consisting of 40,696,349 people shows a weak positive correlation between the proportion of Yuman and percentage of population with at least 6th grade education in the United States with a correlation coefficient (R) of 0.218 and weighted average of 96.7%, a difference of 0.96%.
6th Grade Correlation Summary
| Measurement | Immigrants from Lithuania | Yuman |
| Minimum | 95.5% | 87.9% |
| Maximum | 100.0% | 100.0% |
| Range | 4.5% | 12.1% |
| Mean | 98.5% | 97.6% |
| Median | 98.6% | 98.9% |
| Interquartile 25% (IQ1) | 97.7% | 96.8% |
| Interquartile 75% (IQ3) | 99.2% | 100.0% |
| Interquartile Range (IQR) | 1.5% | 3.2% |
| Standard Deviation (Sample) | 1.2% | 3.1% |
| Standard Deviation (Population) | 1.2% | 3.0% |
Similar Demographics by 6th Grade
Demographics Similar to Immigrants from Lithuania by 6th Grade
In terms of 6th grade, the demographic groups most similar to Immigrants from Lithuania are Icelander (97.6%, a difference of 0.0%), Immigrants from Netherlands (97.6%, a difference of 0.010%), Ukrainian (97.6%, a difference of 0.010%), Immigrants from England (97.6%, a difference of 0.010%), and Immigrants from India (97.6%, a difference of 0.010%).
| Demographics | Rating | Rank | 6th Grade |
| Cajuns | 99.5 /100 | #70 | Exceptional 97.6% |
| Chickasaw | 99.5 /100 | #71 | Exceptional 97.6% |
| Macedonians | 99.4 /100 | #72 | Exceptional 97.6% |
| Cherokee | 99.4 /100 | #73 | Exceptional 97.6% |
| Immigrants | Netherlands | 99.4 /100 | #74 | Exceptional 97.6% |
| Ukrainians | 99.4 /100 | #75 | Exceptional 97.6% |
| Immigrants | England | 99.4 /100 | #76 | Exceptional 97.6% |
| Immigrants | Lithuania | 99.3 /100 | #77 | Exceptional 97.6% |
| Icelanders | 99.3 /100 | #78 | Exceptional 97.6% |
| Immigrants | India | 99.3 /100 | #79 | Exceptional 97.6% |
| Osage | 99.3 /100 | #80 | Exceptional 97.6% |
| Lumbee | 99.2 /100 | #81 | Exceptional 97.6% |
| Zimbabweans | 99.1 /100 | #82 | Exceptional 97.6% |
| Potawatomi | 99.1 /100 | #83 | Exceptional 97.6% |
| Shoshone | 99.0 /100 | #84 | Exceptional 97.6% |
Demographics Similar to Yuman by 6th Grade
In terms of 6th grade, the demographic groups most similar to Yuman are Subsaharan African (96.7%, a difference of 0.010%), South American Indian (96.7%, a difference of 0.010%), Immigrants from Panama (96.7%, a difference of 0.030%), Immigrants from Western Asia (96.7%, a difference of 0.030%), and Immigrants from Malaysia (96.7%, a difference of 0.030%).
| Demographics | Rating | Rank | 6th Grade |
| Immigrants | Panama | 4.2 /100 | #226 | Tragic 96.7% |
| Immigrants | Western Asia | 4.1 /100 | #227 | Tragic 96.7% |
| Immigrants | Malaysia | 4.0 /100 | #228 | Tragic 96.7% |
| Assyrians/Chaldeans/Syriacs | 4.0 /100 | #229 | Tragic 96.7% |
| Immigrants | Eastern Asia | 4.0 /100 | #230 | Tragic 96.7% |
| Sub-Saharan Africans | 3.5 /100 | #231 | Tragic 96.7% |
| South American Indians | 3.5 /100 | #232 | Tragic 96.7% |
| Yuman | 3.2 /100 | #233 | Tragic 96.7% |
| Uruguayans | 2.5 /100 | #234 | Tragic 96.6% |
| Asians | 2.4 /100 | #235 | Tragic 96.6% |
| Immigrants | Indonesia | 2.3 /100 | #236 | Tragic 96.6% |
| Immigrants | Eastern Africa | 2.0 /100 | #237 | Tragic 96.6% |
| Nigerians | 1.9 /100 | #238 | Tragic 96.6% |
| Indians (Asian) | 1.9 /100 | #239 | Tragic 96.6% |
| Koreans | 1.9 /100 | #240 | Tragic 96.6% |