Immigrants from Lithuania vs Immigrants from Latvia No Schooling Completed
COMPARE
Immigrants from Lithuania
Immigrants from Latvia
No Schooling Completed
No Schooling Completed Comparison
Immigrants from Lithuania
Immigrants from Latvia
1.7%
NO SCHOOLING COMPLETED
99.7/ 100
METRIC RATING
68th/ 347
METRIC RANK
1.9%
NO SCHOOLING COMPLETED
96.7/ 100
METRIC RATING
110th/ 347
METRIC RANK
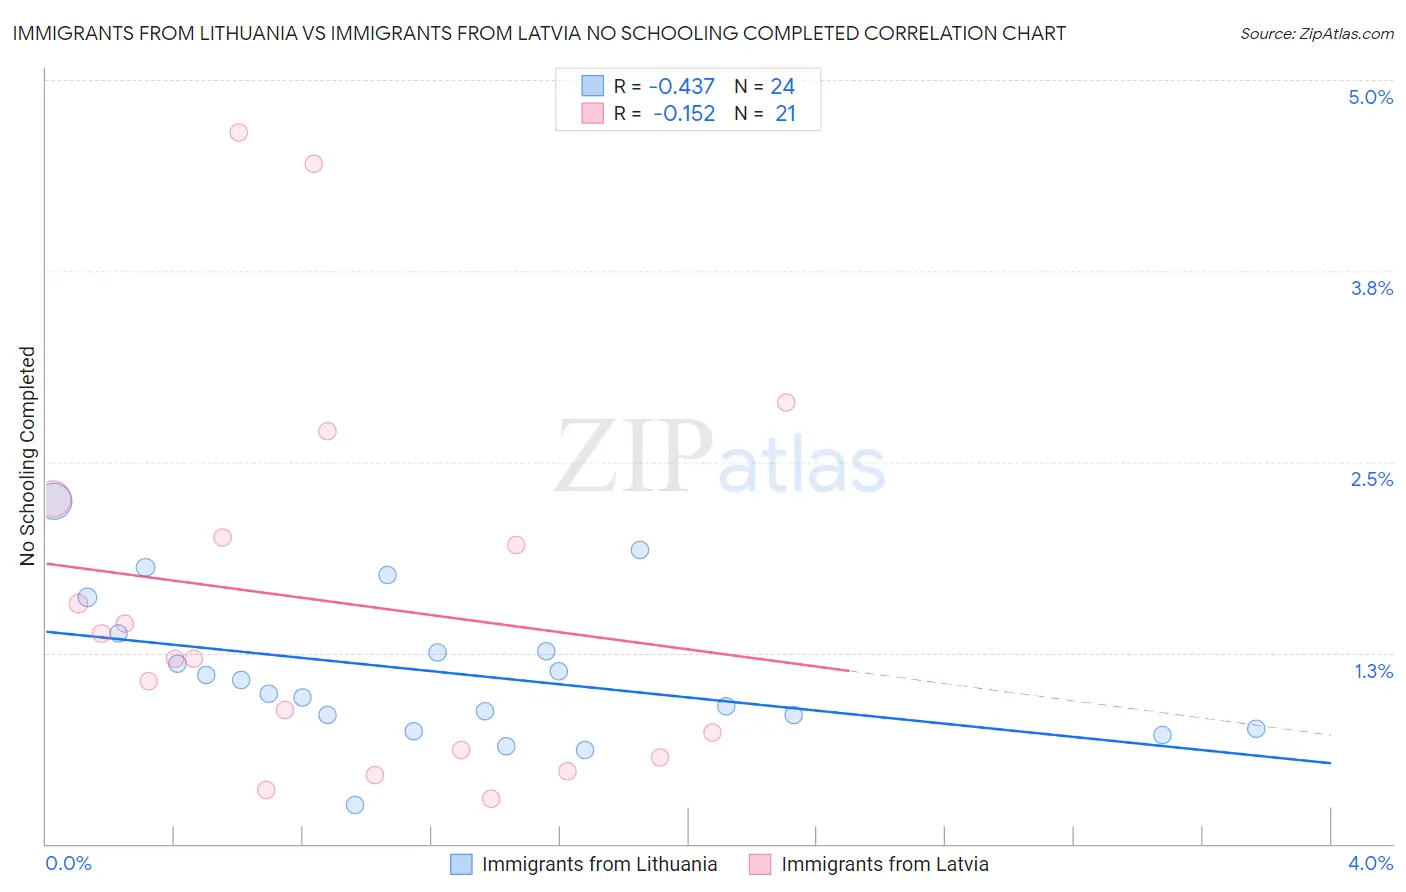
Immigrants from Lithuania vs Immigrants from Latvia No Schooling Completed Correlation Chart
The statistical analysis conducted on geographies consisting of 117,352,056 people shows a moderate negative correlation between the proportion of Immigrants from Lithuania and percentage of population with no schooling in the United States with a correlation coefficient (R) of -0.437 and weighted average of 1.7%. Similarly, the statistical analysis conducted on geographies consisting of 113,303,053 people shows a poor negative correlation between the proportion of Immigrants from Latvia and percentage of population with no schooling in the United States with a correlation coefficient (R) of -0.152 and weighted average of 1.9%, a difference of 9.7%.
No Schooling Completed Correlation Summary
| Measurement | Immigrants from Lithuania | Immigrants from Latvia |
| Minimum | 0.25% | 0.30% |
| Maximum | 2.2% | 4.7% |
| Range | 2.0% | 4.4% |
| Mean | 1.1% | 1.6% |
| Median | 1.0% | 1.2% |
| Interquartile 25% (IQ1) | 0.80% | 0.59% |
| Interquartile 75% (IQ3) | 1.3% | 2.1% |
| Interquartile Range (IQR) | 0.52% | 1.5% |
| Standard Deviation (Sample) | 0.47% | 1.2% |
| Standard Deviation (Population) | 0.46% | 1.2% |
Similar Demographics by No Schooling Completed
Demographics Similar to Immigrants from Lithuania by No Schooling Completed
In terms of no schooling completed, the demographic groups most similar to Immigrants from Lithuania are Chickasaw (1.7%, a difference of 0.27%), Immigrants from Austria (1.7%, a difference of 0.75%), Canadian (1.7%, a difference of 0.94%), Serbian (1.7%, a difference of 1.1%), and New Zealander (1.7%, a difference of 1.1%).
| Demographics | Rating | Rank | No Schooling Completed |
| Tsimshian | 99.8 /100 | #61 | Exceptional 1.7% |
| Immigrants | Northern Europe | 99.8 /100 | #62 | Exceptional 1.7% |
| Russians | 99.8 /100 | #63 | Exceptional 1.7% |
| New Zealanders | 99.7 /100 | #64 | Exceptional 1.7% |
| Serbians | 99.7 /100 | #65 | Exceptional 1.7% |
| Canadians | 99.7 /100 | #66 | Exceptional 1.7% |
| Immigrants | Austria | 99.7 /100 | #67 | Exceptional 1.7% |
| Immigrants | Lithuania | 99.7 /100 | #68 | Exceptional 1.7% |
| Chickasaw | 99.6 /100 | #69 | Exceptional 1.7% |
| Immigrants | Netherlands | 99.6 /100 | #70 | Exceptional 1.7% |
| Immigrants | England | 99.5 /100 | #71 | Exceptional 1.7% |
| Cajuns | 99.5 /100 | #72 | Exceptional 1.7% |
| Immigrants | India | 99.4 /100 | #73 | Exceptional 1.7% |
| Zimbabweans | 99.4 /100 | #74 | Exceptional 1.7% |
| Immigrants | Belgium | 99.3 /100 | #75 | Exceptional 1.7% |
Demographics Similar to Immigrants from Latvia by No Schooling Completed
In terms of no schooling completed, the demographic groups most similar to Immigrants from Latvia are Immigrants from Saudi Arabia (1.9%, a difference of 0.13%), Immigrants from Japan (1.9%, a difference of 0.15%), Pueblo (1.9%, a difference of 0.33%), Okinawan (1.8%, a difference of 0.48%), and Immigrants from Zimbabwe (1.9%, a difference of 0.58%).
| Demographics | Rating | Rank | No Schooling Completed |
| Basques | 97.9 /100 | #103 | Exceptional 1.8% |
| Thais | 97.5 /100 | #104 | Exceptional 1.8% |
| German Russians | 97.5 /100 | #105 | Exceptional 1.8% |
| Immigrants | France | 97.3 /100 | #106 | Exceptional 1.8% |
| Yugoslavians | 97.2 /100 | #107 | Exceptional 1.8% |
| Okinawans | 97.1 /100 | #108 | Exceptional 1.8% |
| Immigrants | Saudi Arabia | 96.8 /100 | #109 | Exceptional 1.9% |
| Immigrants | Latvia | 96.7 /100 | #110 | Exceptional 1.9% |
| Immigrants | Japan | 96.6 /100 | #111 | Exceptional 1.9% |
| Pueblo | 96.4 /100 | #112 | Exceptional 1.9% |
| Immigrants | Zimbabwe | 96.2 /100 | #113 | Exceptional 1.9% |
| Immigrants | Norway | 96.1 /100 | #114 | Exceptional 1.9% |
| Syrians | 96.0 /100 | #115 | Exceptional 1.9% |
| Lebanese | 96.0 /100 | #116 | Exceptional 1.9% |
| Immigrants | Serbia | 95.8 /100 | #117 | Exceptional 1.9% |