Immigrants from Lithuania vs Immigrants from Costa Rica 10th Grade
COMPARE
Immigrants from Lithuania
Immigrants from Costa Rica
10th Grade
10th Grade Comparison
Immigrants from Lithuania
Immigrants from Costa Rica
95.0%
10TH GRADE
99.8/ 100
METRIC RATING
54th/ 347
METRIC RANK
92.7%
10TH GRADE
0.6/ 100
METRIC RATING
258th/ 347
METRIC RANK
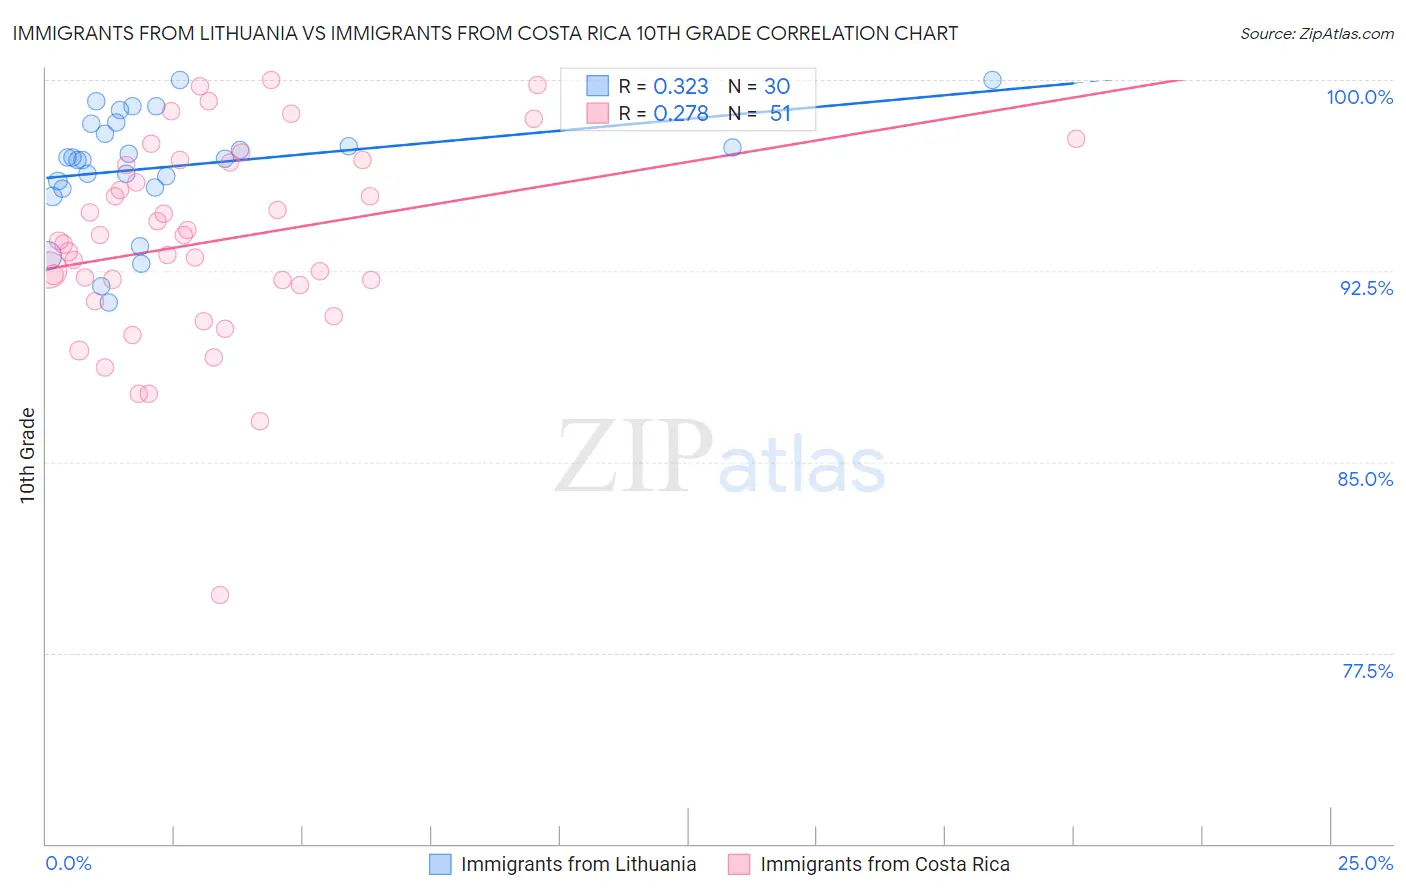
Immigrants from Lithuania vs Immigrants from Costa Rica 10th Grade Correlation Chart
The statistical analysis conducted on geographies consisting of 117,724,932 people shows a mild positive correlation between the proportion of Immigrants from Lithuania and percentage of population with at least 10th grade education in the United States with a correlation coefficient (R) of 0.323 and weighted average of 95.0%. Similarly, the statistical analysis conducted on geographies consisting of 204,277,241 people shows a weak positive correlation between the proportion of Immigrants from Costa Rica and percentage of population with at least 10th grade education in the United States with a correlation coefficient (R) of 0.278 and weighted average of 92.7%, a difference of 2.5%.
10th Grade Correlation Summary
| Measurement | Immigrants from Lithuania | Immigrants from Costa Rica |
| Minimum | 91.3% | 79.8% |
| Maximum | 100.0% | 100.0% |
| Range | 8.7% | 20.2% |
| Mean | 96.6% | 93.7% |
| Median | 96.9% | 93.7% |
| Interquartile 25% (IQ1) | 95.8% | 91.9% |
| Interquartile 75% (IQ3) | 98.3% | 96.8% |
| Interquartile Range (IQR) | 2.5% | 4.9% |
| Standard Deviation (Sample) | 2.2% | 3.9% |
| Standard Deviation (Population) | 2.2% | 3.9% |
Similar Demographics by 10th Grade
Demographics Similar to Immigrants from Lithuania by 10th Grade
In terms of 10th grade, the demographic groups most similar to Immigrants from Lithuania are Immigrants from Ireland (95.0%, a difference of 0.010%), Immigrants from North America (95.0%, a difference of 0.020%), New Zealander (95.0%, a difference of 0.020%), Ukrainian (95.0%, a difference of 0.020%), and Aleut (95.0%, a difference of 0.020%).
| Demographics | Rating | Rank | 10th Grade |
| Serbians | 99.9 /100 | #47 | Exceptional 95.1% |
| Australians | 99.9 /100 | #48 | Exceptional 95.1% |
| Immigrants | Austria | 99.9 /100 | #49 | Exceptional 95.1% |
| Immigrants | Canada | 99.8 /100 | #50 | Exceptional 95.1% |
| Austrians | 99.8 /100 | #51 | Exceptional 95.1% |
| Ottawa | 99.8 /100 | #52 | Exceptional 95.1% |
| Immigrants | North America | 99.8 /100 | #53 | Exceptional 95.0% |
| Immigrants | Lithuania | 99.8 /100 | #54 | Exceptional 95.0% |
| Immigrants | Ireland | 99.8 /100 | #55 | Exceptional 95.0% |
| New Zealanders | 99.8 /100 | #56 | Exceptional 95.0% |
| Ukrainians | 99.8 /100 | #57 | Exceptional 95.0% |
| Aleuts | 99.8 /100 | #58 | Exceptional 95.0% |
| Celtics | 99.8 /100 | #59 | Exceptional 95.0% |
| Cypriots | 99.8 /100 | #60 | Exceptional 95.0% |
| Chippewa | 99.8 /100 | #61 | Exceptional 95.0% |
Demographics Similar to Immigrants from Costa Rica by 10th Grade
In terms of 10th grade, the demographic groups most similar to Immigrants from Costa Rica are U.S. Virgin Islander (92.7%, a difference of 0.010%), Immigrants from Nigeria (92.7%, a difference of 0.020%), Immigrants from Bolivia (92.7%, a difference of 0.030%), Immigrants from Jamaica (92.6%, a difference of 0.040%), and Immigrants from Uzbekistan (92.6%, a difference of 0.050%).
| Demographics | Rating | Rank | 10th Grade |
| Immigrants | Thailand | 1.0 /100 | #251 | Tragic 92.8% |
| South Americans | 0.9 /100 | #252 | Tragic 92.8% |
| Ghanaians | 0.9 /100 | #253 | Tragic 92.8% |
| Armenians | 0.9 /100 | #254 | Tragic 92.7% |
| Immigrants | Bolivia | 0.7 /100 | #255 | Tragic 92.7% |
| Immigrants | Nigeria | 0.7 /100 | #256 | Tragic 92.7% |
| U.S. Virgin Islanders | 0.7 /100 | #257 | Tragic 92.7% |
| Immigrants | Costa Rica | 0.6 /100 | #258 | Tragic 92.7% |
| Immigrants | Jamaica | 0.5 /100 | #259 | Tragic 92.6% |
| Immigrants | Uzbekistan | 0.5 /100 | #260 | Tragic 92.6% |
| Paiute | 0.4 /100 | #261 | Tragic 92.6% |
| Immigrants | South America | 0.4 /100 | #262 | Tragic 92.6% |
| Apache | 0.4 /100 | #263 | Tragic 92.6% |
| Peruvians | 0.4 /100 | #264 | Tragic 92.6% |
| Dutch West Indians | 0.4 /100 | #265 | Tragic 92.6% |