Immigrants from Lithuania vs Immigrants from Barbados Master's Degree
COMPARE
Immigrants from Lithuania
Immigrants from Barbados
Master's Degree
Master's Degree Comparison
Immigrants from Lithuania
Immigrants from Barbados
18.5%
MASTER'S DEGREE
99.9/ 100
METRIC RATING
54th/ 347
METRIC RANK
14.3%
MASTER'S DEGREE
20.5/ 100
METRIC RATING
208th/ 347
METRIC RANK
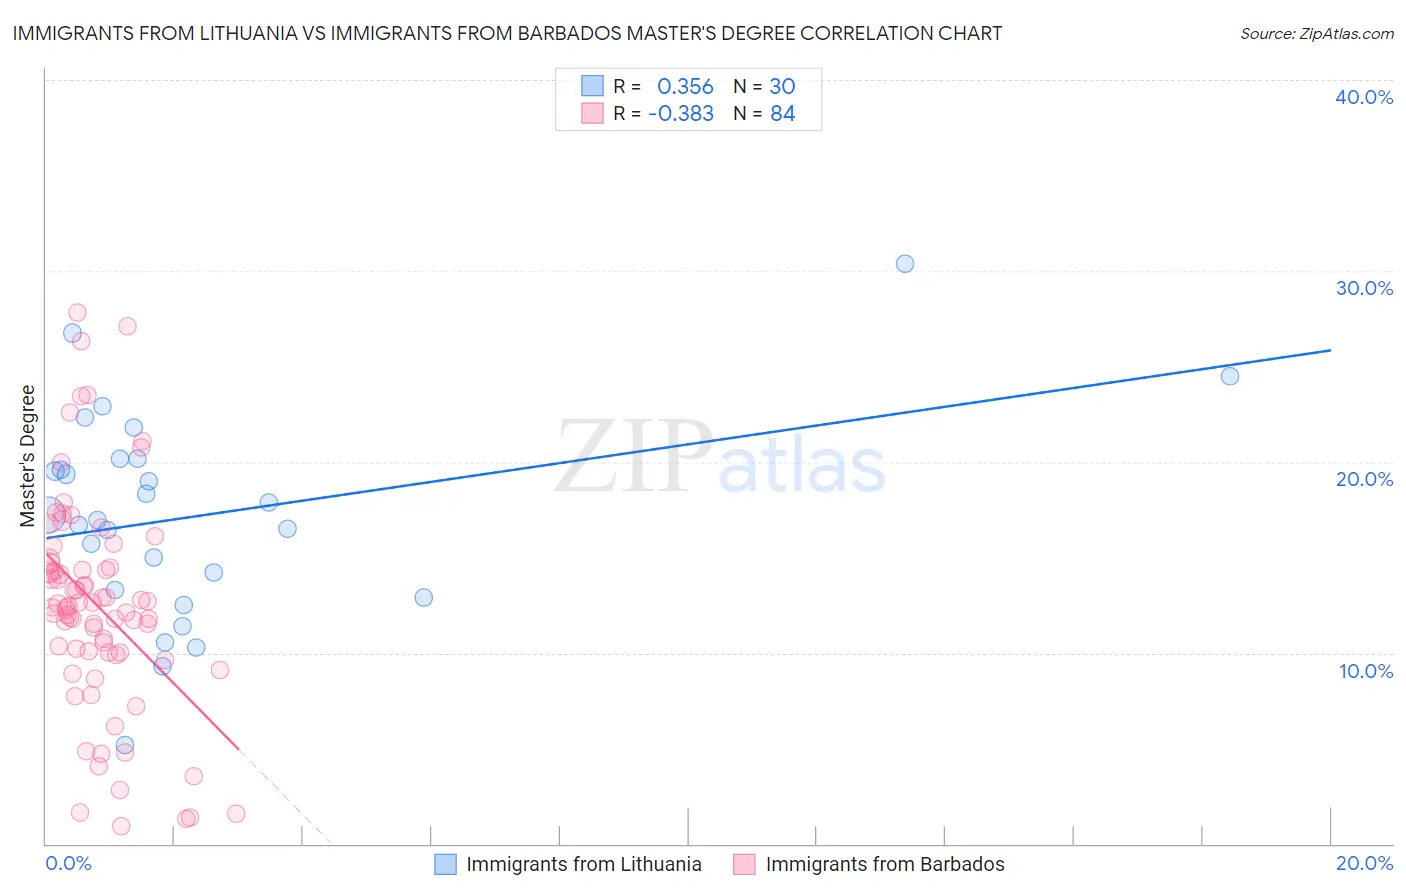
Immigrants from Lithuania vs Immigrants from Barbados Master's Degree Correlation Chart
The statistical analysis conducted on geographies consisting of 117,722,731 people shows a mild positive correlation between the proportion of Immigrants from Lithuania and percentage of population with at least master's degree education in the United States with a correlation coefficient (R) of 0.356 and weighted average of 18.5%. Similarly, the statistical analysis conducted on geographies consisting of 112,776,866 people shows a mild negative correlation between the proportion of Immigrants from Barbados and percentage of population with at least master's degree education in the United States with a correlation coefficient (R) of -0.383 and weighted average of 14.3%, a difference of 29.5%.
Master's Degree Correlation Summary
| Measurement | Immigrants from Lithuania | Immigrants from Barbados |
| Minimum | 5.1% | 0.92% |
| Maximum | 30.4% | 27.8% |
| Range | 25.3% | 26.9% |
| Mean | 17.2% | 12.5% |
| Median | 17.1% | 12.4% |
| Interquartile 25% (IQ1) | 13.3% | 10.0% |
| Interquartile 75% (IQ3) | 20.1% | 14.6% |
| Interquartile Range (IQR) | 6.8% | 4.6% |
| Standard Deviation (Sample) | 5.4% | 5.7% |
| Standard Deviation (Population) | 5.3% | 5.6% |
Similar Demographics by Master's Degree
Demographics Similar to Immigrants from Lithuania by Master's Degree
In terms of master's degree, the demographic groups most similar to Immigrants from Lithuania are Immigrants from Serbia (18.5%, a difference of 0.030%), Asian (18.4%, a difference of 0.26%), Immigrants from Czechoslovakia (18.5%, a difference of 0.31%), Immigrants from Kuwait (18.6%, a difference of 0.39%), and Immigrants from Asia (18.4%, a difference of 0.39%).
| Demographics | Rating | Rank | Master's Degree |
| Immigrants | Austria | 100.0 /100 | #47 | Exceptional 18.8% |
| Paraguayans | 100.0 /100 | #48 | Exceptional 18.8% |
| Estonians | 100.0 /100 | #49 | Exceptional 18.8% |
| Bulgarians | 100.0 /100 | #50 | Exceptional 18.8% |
| Immigrants | South Africa | 100.0 /100 | #51 | Exceptional 18.8% |
| Immigrants | Kuwait | 100.0 /100 | #52 | Exceptional 18.6% |
| Immigrants | Czechoslovakia | 99.9 /100 | #53 | Exceptional 18.5% |
| Immigrants | Lithuania | 99.9 /100 | #54 | Exceptional 18.5% |
| Immigrants | Serbia | 99.9 /100 | #55 | Exceptional 18.5% |
| Asians | 99.9 /100 | #56 | Exceptional 18.4% |
| Immigrants | Asia | 99.9 /100 | #57 | Exceptional 18.4% |
| Australians | 99.9 /100 | #58 | Exceptional 18.4% |
| Immigrants | Bulgaria | 99.9 /100 | #59 | Exceptional 18.3% |
| New Zealanders | 99.9 /100 | #60 | Exceptional 18.3% |
| Immigrants | Europe | 99.9 /100 | #61 | Exceptional 18.2% |
Demographics Similar to Immigrants from Barbados by Master's Degree
In terms of master's degree, the demographic groups most similar to Immigrants from Barbados are Immigrants from Panama (14.3%, a difference of 0.090%), Subsaharan African (14.2%, a difference of 0.22%), Immigrants from Bosnia and Herzegovina (14.3%, a difference of 0.30%), Somali (14.2%, a difference of 0.53%), and Scandinavian (14.4%, a difference of 0.55%).
| Demographics | Rating | Rank | Master's Degree |
| Scotch-Irish | 25.0 /100 | #201 | Fair 14.4% |
| Immigrants | Western Africa | 24.9 /100 | #202 | Fair 14.4% |
| Yugoslavians | 24.3 /100 | #203 | Fair 14.4% |
| French | 23.7 /100 | #204 | Fair 14.4% |
| Trinidadians and Tobagonians | 23.5 /100 | #205 | Fair 14.4% |
| Scandinavians | 23.3 /100 | #206 | Fair 14.4% |
| Immigrants | Bosnia and Herzegovina | 22.0 /100 | #207 | Fair 14.3% |
| Immigrants | Barbados | 20.5 /100 | #208 | Fair 14.3% |
| Immigrants | Panama | 20.0 /100 | #209 | Fair 14.3% |
| Sub-Saharan Africans | 19.4 /100 | #210 | Poor 14.2% |
| Somalis | 18.0 /100 | #211 | Poor 14.2% |
| Spanish | 17.8 /100 | #212 | Poor 14.2% |
| Immigrants | Thailand | 17.0 /100 | #213 | Poor 14.2% |
| Finns | 16.9 /100 | #214 | Poor 14.2% |
| Immigrants | Vietnam | 16.1 /100 | #215 | Poor 14.1% |