Immigrants from Liberia vs Slovak Bachelor's Degree
COMPARE
Immigrants from Liberia
Slovak
Bachelor's Degree
Bachelor's Degree Comparison
Immigrants from Liberia
Slovaks
33.5%
BACHELOR'S DEGREE
0.9/ 100
METRIC RATING
249th/ 347
METRIC RANK
37.3%
BACHELOR'S DEGREE
36.9/ 100
METRIC RATING
189th/ 347
METRIC RANK
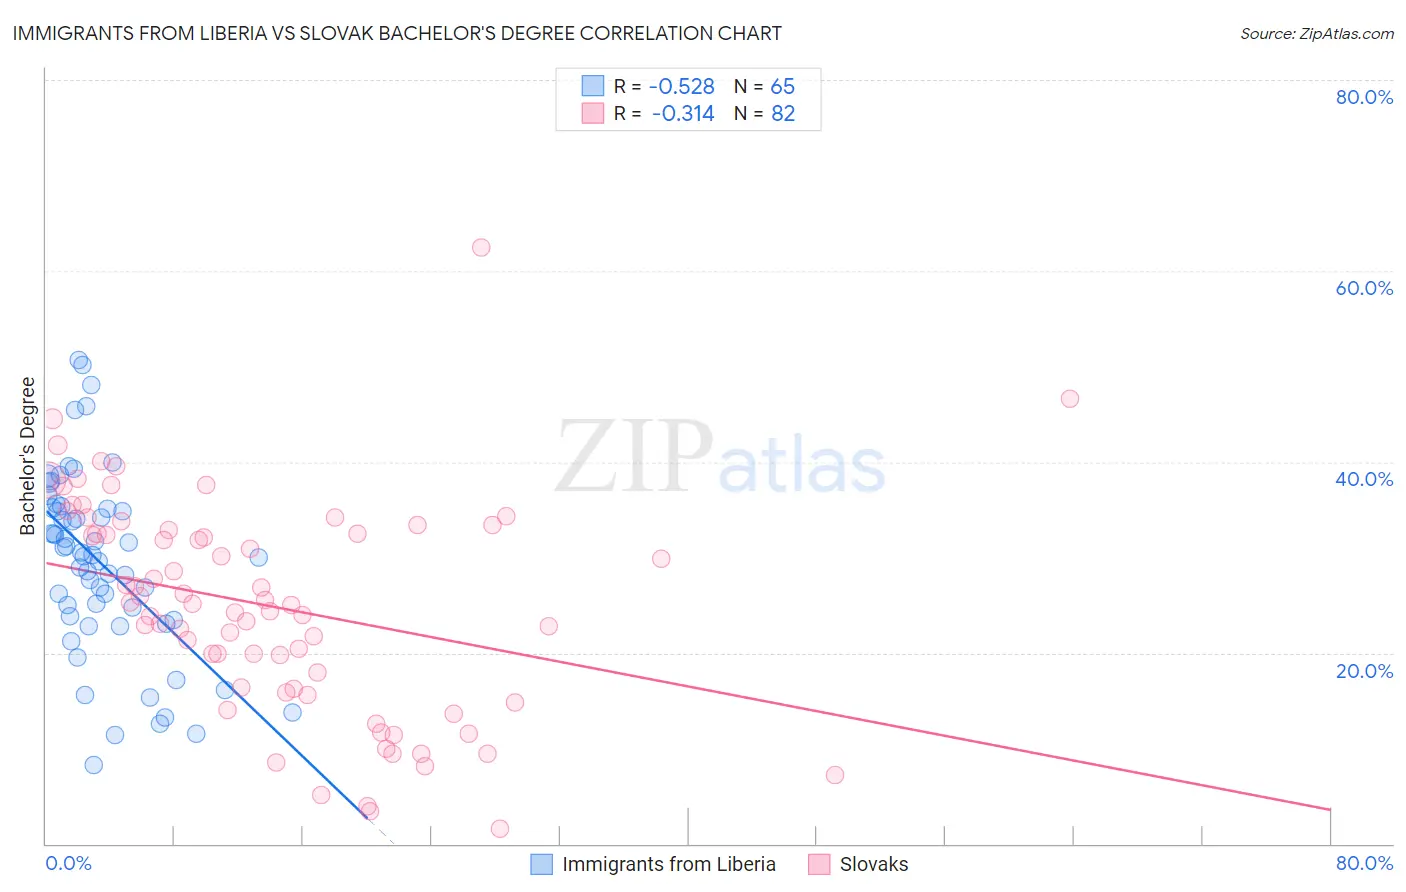
Immigrants from Liberia vs Slovak Bachelor's Degree Correlation Chart
The statistical analysis conducted on geographies consisting of 135,292,805 people shows a substantial negative correlation between the proportion of Immigrants from Liberia and percentage of population with at least bachelor's degree education in the United States with a correlation coefficient (R) of -0.528 and weighted average of 33.5%. Similarly, the statistical analysis conducted on geographies consisting of 397,863,684 people shows a mild negative correlation between the proportion of Slovaks and percentage of population with at least bachelor's degree education in the United States with a correlation coefficient (R) of -0.314 and weighted average of 37.3%, a difference of 11.3%.
Bachelor's Degree Correlation Summary
| Measurement | Immigrants from Liberia | Slovak |
| Minimum | 8.2% | 1.5% |
| Maximum | 50.7% | 62.5% |
| Range | 42.4% | 61.0% |
| Mean | 29.4% | 24.8% |
| Median | 30.3% | 25.1% |
| Interquartile 25% (IQ1) | 23.6% | 16.2% |
| Interquartile 75% (IQ3) | 35.1% | 32.9% |
| Interquartile Range (IQR) | 11.5% | 16.7% |
| Standard Deviation (Sample) | 9.5% | 11.3% |
| Standard Deviation (Population) | 9.5% | 11.3% |
Similar Demographics by Bachelor's Degree
Demographics Similar to Immigrants from Liberia by Bachelor's Degree
In terms of bachelor's degree, the demographic groups most similar to Immigrants from Liberia are Indonesian (33.5%, a difference of 0.010%), Cree (33.6%, a difference of 0.13%), Immigrants from Congo (33.6%, a difference of 0.14%), Jamaican (33.6%, a difference of 0.23%), and Immigrants from Fiji (33.7%, a difference of 0.59%).
| Demographics | Rating | Rank | Bachelor's Degree |
| Immigrants | Nonimmigrants | 1.8 /100 | #242 | Tragic 34.2% |
| Immigrants | Guyana | 1.4 /100 | #243 | Tragic 33.9% |
| Delaware | 1.2 /100 | #244 | Tragic 33.8% |
| Immigrants | Fiji | 1.2 /100 | #245 | Tragic 33.7% |
| Jamaicans | 1.0 /100 | #246 | Tragic 33.6% |
| Immigrants | Congo | 1.0 /100 | #247 | Tragic 33.6% |
| Cree | 1.0 /100 | #248 | Tragic 33.6% |
| Immigrants | Liberia | 0.9 /100 | #249 | Tragic 33.5% |
| Indonesians | 0.9 /100 | #250 | Tragic 33.5% |
| Japanese | 0.7 /100 | #251 | Tragic 33.3% |
| Immigrants | Bahamas | 0.7 /100 | #252 | Tragic 33.3% |
| U.S. Virgin Islanders | 0.7 /100 | #253 | Tragic 33.2% |
| Native Hawaiians | 0.7 /100 | #254 | Tragic 33.2% |
| Iroquois | 0.7 /100 | #255 | Tragic 33.2% |
| Nicaraguans | 0.6 /100 | #256 | Tragic 33.1% |
Demographics Similar to Slovaks by Bachelor's Degree
In terms of bachelor's degree, the demographic groups most similar to Slovaks are Immigrants from Oceania (37.3%, a difference of 0.050%), English (37.4%, a difference of 0.29%), Swiss (37.2%, a difference of 0.30%), Nigerian (37.2%, a difference of 0.32%), and Norwegian (37.5%, a difference of 0.36%).
| Demographics | Rating | Rank | Bachelor's Degree |
| Immigrants | Bosnia and Herzegovina | 43.4 /100 | #182 | Average 37.6% |
| Senegalese | 42.2 /100 | #183 | Average 37.5% |
| Scandinavians | 41.7 /100 | #184 | Average 37.5% |
| Immigrants | Peru | 41.3 /100 | #185 | Average 37.5% |
| Norwegians | 40.4 /100 | #186 | Average 37.5% |
| English | 39.7 /100 | #187 | Fair 37.4% |
| Immigrants | Oceania | 37.3 /100 | #188 | Fair 37.3% |
| Slovaks | 36.9 /100 | #189 | Fair 37.3% |
| Swiss | 34.1 /100 | #190 | Fair 37.2% |
| Nigerians | 33.9 /100 | #191 | Fair 37.2% |
| Immigrants | Vietnam | 32.1 /100 | #192 | Fair 37.1% |
| Yugoslavians | 31.5 /100 | #193 | Fair 37.1% |
| Belgians | 29.9 /100 | #194 | Fair 37.0% |
| Koreans | 29.8 /100 | #195 | Fair 37.0% |
| Celtics | 29.5 /100 | #196 | Fair 37.0% |