Immigrants from Liberia vs Chilean Kindergarten
COMPARE
Immigrants from Liberia
Chilean
Kindergarten
Kindergarten Comparison
Immigrants from Liberia
Chileans
97.5%
KINDERGARTEN
0.3/ 100
METRIC RATING
267th/ 347
METRIC RANK
98.0%
KINDERGARTEN
56.3/ 100
METRIC RATING
166th/ 347
METRIC RANK
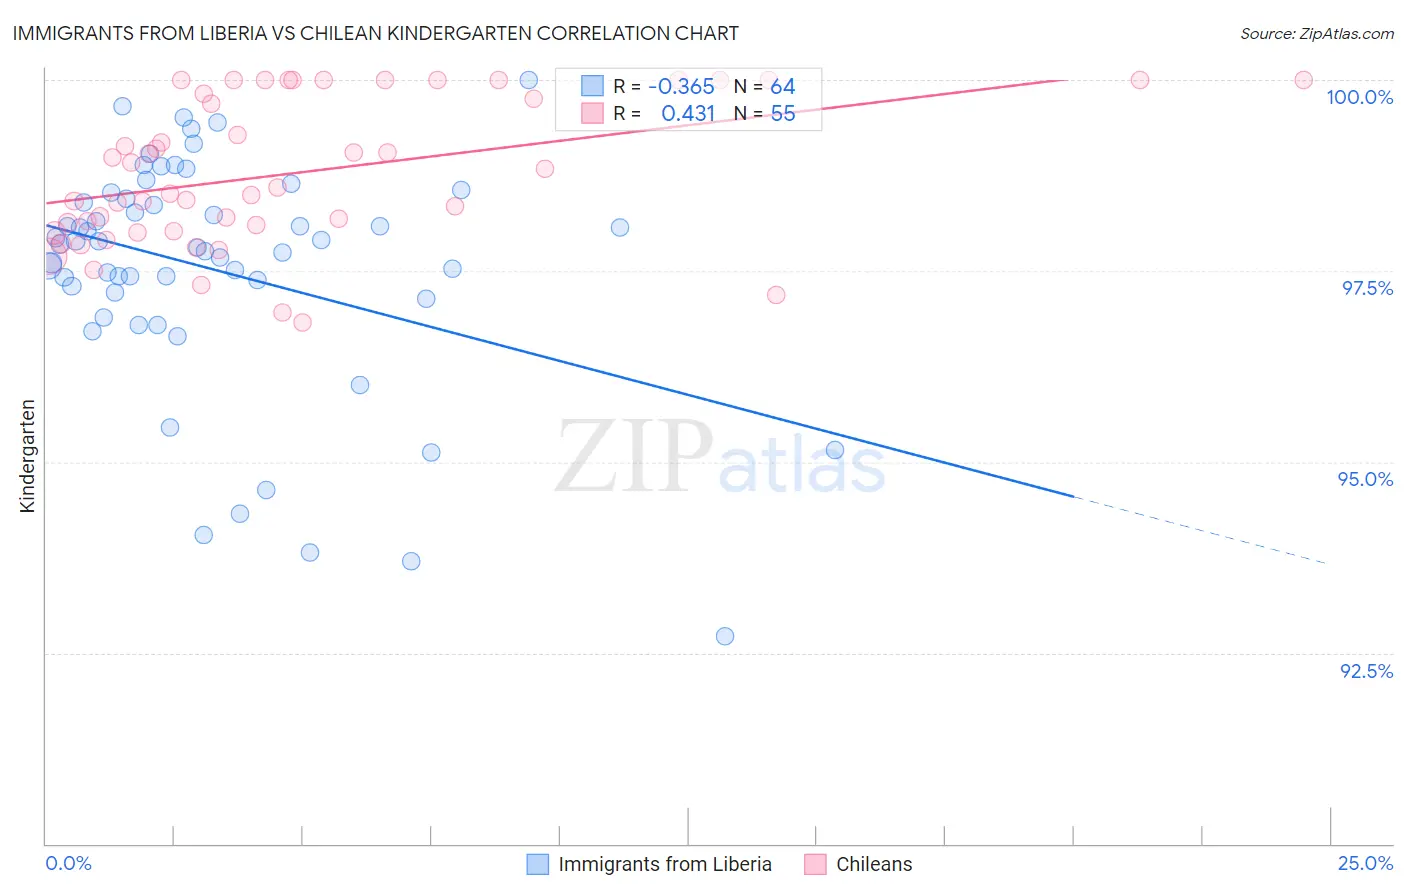
Immigrants from Liberia vs Chilean Kindergarten Correlation Chart
The statistical analysis conducted on geographies consisting of 135,294,272 people shows a mild negative correlation between the proportion of Immigrants from Liberia and percentage of population with at least kindergarten education in the United States with a correlation coefficient (R) of -0.365 and weighted average of 97.5%. Similarly, the statistical analysis conducted on geographies consisting of 256,684,337 people shows a moderate positive correlation between the proportion of Chileans and percentage of population with at least kindergarten education in the United States with a correlation coefficient (R) of 0.431 and weighted average of 98.0%, a difference of 0.47%.
Kindergarten Correlation Summary
| Measurement | Immigrants from Liberia | Chilean |
| Minimum | 92.7% | 96.8% |
| Maximum | 100.0% | 100.0% |
| Range | 7.3% | 3.2% |
| Mean | 97.5% | 98.8% |
| Median | 97.8% | 98.6% |
| Interquartile 25% (IQ1) | 97.2% | 98.0% |
| Interquartile 75% (IQ3) | 98.4% | 100.0% |
| Interquartile Range (IQR) | 1.2% | 2.0% |
| Standard Deviation (Sample) | 1.5% | 0.95% |
| Standard Deviation (Population) | 1.5% | 0.94% |
Similar Demographics by Kindergarten
Demographics Similar to Immigrants from Liberia by Kindergarten
In terms of kindergarten, the demographic groups most similar to Immigrants from Liberia are Immigrants from Nigeria (97.5%, a difference of 0.0%), Cuban (97.5%, a difference of 0.010%), Immigrants from Sierra Leone (97.5%, a difference of 0.010%), West Indian (97.5%, a difference of 0.010%), and Immigrants from South America (97.5%, a difference of 0.020%).
| Demographics | Rating | Rank | Kindergarten |
| Fijians | 0.5 /100 | #260 | Tragic 97.5% |
| Taiwanese | 0.4 /100 | #261 | Tragic 97.5% |
| Immigrants | Ethiopia | 0.4 /100 | #262 | Tragic 97.5% |
| Immigrants | South America | 0.4 /100 | #263 | Tragic 97.5% |
| Assyrians/Chaldeans/Syriacs | 0.4 /100 | #264 | Tragic 97.5% |
| Cubans | 0.3 /100 | #265 | Tragic 97.5% |
| Immigrants | Sierra Leone | 0.3 /100 | #266 | Tragic 97.5% |
| Immigrants | Liberia | 0.3 /100 | #267 | Tragic 97.5% |
| Immigrants | Nigeria | 0.3 /100 | #268 | Tragic 97.5% |
| West Indians | 0.3 /100 | #269 | Tragic 97.5% |
| Immigrants | Jamaica | 0.2 /100 | #270 | Tragic 97.5% |
| Immigrants | Peru | 0.2 /100 | #271 | Tragic 97.5% |
| Immigrants | Bolivia | 0.2 /100 | #272 | Tragic 97.5% |
| Immigrants | China | 0.1 /100 | #273 | Tragic 97.4% |
| Immigrants | Cameroon | 0.1 /100 | #274 | Tragic 97.4% |
Demographics Similar to Chileans by Kindergarten
In terms of kindergarten, the demographic groups most similar to Chileans are Spanish American (98.0%, a difference of 0.0%), Immigrants from Micronesia (98.0%, a difference of 0.0%), Ugandan (98.0%, a difference of 0.0%), Immigrants from Russia (98.0%, a difference of 0.010%), and Immigrants from Eastern Europe (98.0%, a difference of 0.010%).
| Demographics | Rating | Rank | Kindergarten |
| French American Indians | 63.7 /100 | #159 | Good 98.0% |
| Immigrants | Russia | 59.0 /100 | #160 | Average 98.0% |
| Immigrants | Eastern Europe | 59.0 /100 | #161 | Average 98.0% |
| Immigrants | Italy | 58.9 /100 | #162 | Average 98.0% |
| Spanish Americans | 57.8 /100 | #163 | Average 98.0% |
| Immigrants | Micronesia | 57.7 /100 | #164 | Average 98.0% |
| Ugandans | 56.9 /100 | #165 | Average 98.0% |
| Chileans | 56.3 /100 | #166 | Average 98.0% |
| Immigrants | Spain | 54.6 /100 | #167 | Average 98.0% |
| Navajo | 54.4 /100 | #168 | Average 98.0% |
| Immigrants | Korea | 54.1 /100 | #169 | Average 98.0% |
| Bermudans | 54.0 /100 | #170 | Average 98.0% |
| Immigrants | Jordan | 54.0 /100 | #171 | Average 98.0% |
| Natives/Alaskans | 51.0 /100 | #172 | Average 98.0% |
| Kenyans | 51.0 /100 | #173 | Average 98.0% |