Immigrants from Lebanon vs Tongan 2nd Grade
COMPARE
Immigrants from Lebanon
Tongan
2nd Grade
2nd Grade Comparison
Immigrants from Lebanon
Tongans
97.8%
2ND GRADE
20.9/ 100
METRIC RATING
200th/ 347
METRIC RANK
97.6%
2ND GRADE
4.3/ 100
METRIC RATING
225th/ 347
METRIC RANK
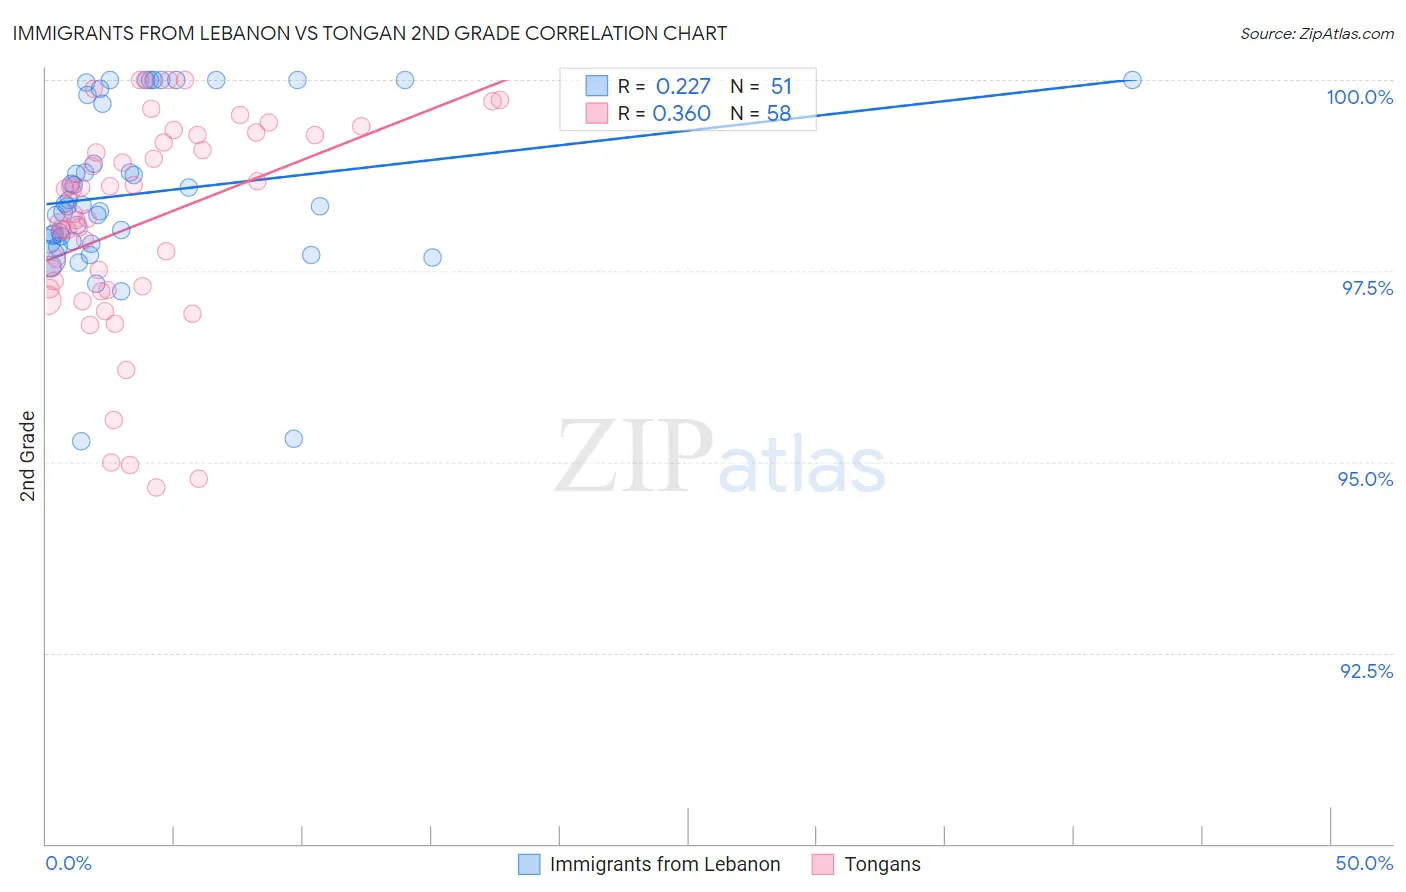
Immigrants from Lebanon vs Tongan 2nd Grade Correlation Chart
The statistical analysis conducted on geographies consisting of 217,102,284 people shows a weak positive correlation between the proportion of Immigrants from Lebanon and percentage of population with at least 2nd grade education in the United States with a correlation coefficient (R) of 0.227 and weighted average of 97.8%. Similarly, the statistical analysis conducted on geographies consisting of 102,908,759 people shows a mild positive correlation between the proportion of Tongans and percentage of population with at least 2nd grade education in the United States with a correlation coefficient (R) of 0.360 and weighted average of 97.6%, a difference of 0.14%.
2nd Grade Correlation Summary
| Measurement | Immigrants from Lebanon | Tongan |
| Minimum | 95.3% | 94.7% |
| Maximum | 100.0% | 100.0% |
| Range | 4.7% | 5.3% |
| Mean | 98.5% | 98.1% |
| Median | 98.4% | 98.2% |
| Interquartile 25% (IQ1) | 97.9% | 97.3% |
| Interquartile 75% (IQ3) | 99.8% | 99.3% |
| Interquartile Range (IQR) | 1.9% | 2.0% |
| Standard Deviation (Sample) | 1.1% | 1.4% |
| Standard Deviation (Population) | 1.1% | 1.4% |
Similar Demographics by 2nd Grade
Demographics Similar to Immigrants from Lebanon by 2nd Grade
In terms of 2nd grade, the demographic groups most similar to Immigrants from Lebanon are Tohono O'odham (97.8%, a difference of 0.0%), Immigrants from Ukraine (97.8%, a difference of 0.0%), Yuman (97.8%, a difference of 0.0%), Immigrants from Albania (97.8%, a difference of 0.010%), and Immigrants from Southern Europe (97.8%, a difference of 0.010%).
| Demographics | Rating | Rank | 2nd Grade |
| Hawaiians | 28.5 /100 | #193 | Fair 97.8% |
| Paiute | 27.0 /100 | #194 | Fair 97.8% |
| Mongolians | 26.7 /100 | #195 | Fair 97.8% |
| Immigrants | Kenya | 26.4 /100 | #196 | Fair 97.8% |
| Immigrants | Uganda | 26.3 /100 | #197 | Fair 97.8% |
| Guamanians/Chamorros | 25.7 /100 | #198 | Fair 97.8% |
| Immigrants | Egypt | 24.4 /100 | #199 | Fair 97.8% |
| Immigrants | Lebanon | 20.9 /100 | #200 | Fair 97.8% |
| Tohono O'odham | 20.9 /100 | #201 | Fair 97.8% |
| Immigrants | Ukraine | 20.5 /100 | #202 | Fair 97.8% |
| Yuman | 20.0 /100 | #203 | Fair 97.8% |
| Immigrants | Albania | 18.4 /100 | #204 | Poor 97.8% |
| Immigrants | Southern Europe | 18.1 /100 | #205 | Poor 97.8% |
| Immigrants | Chile | 17.3 /100 | #206 | Poor 97.7% |
| Africans | 15.6 /100 | #207 | Poor 97.7% |
Demographics Similar to Tongans by 2nd Grade
In terms of 2nd grade, the demographic groups most similar to Tongans are Immigrants from Sudan (97.6%, a difference of 0.0%), Sierra Leonean (97.6%, a difference of 0.0%), Immigrants from Zaire (97.6%, a difference of 0.0%), Immigrants from Morocco (97.6%, a difference of 0.010%), and Iraqi (97.6%, a difference of 0.010%).
| Demographics | Rating | Rank | 2nd Grade |
| Sudanese | 5.7 /100 | #218 | Tragic 97.7% |
| Immigrants | Panama | 5.1 /100 | #219 | Tragic 97.6% |
| Immigrants | Morocco | 5.0 /100 | #220 | Tragic 97.6% |
| Iraqis | 4.6 /100 | #221 | Tragic 97.6% |
| Immigrants | Sudan | 4.5 /100 | #222 | Tragic 97.6% |
| Sierra Leoneans | 4.3 /100 | #223 | Tragic 97.6% |
| Immigrants | Zaire | 4.3 /100 | #224 | Tragic 97.6% |
| Tongans | 4.3 /100 | #225 | Tragic 97.6% |
| Immigrants | Syria | 4.0 /100 | #226 | Tragic 97.6% |
| Immigrants | Nepal | 4.0 /100 | #227 | Tragic 97.6% |
| Sub-Saharan Africans | 3.4 /100 | #228 | Tragic 97.6% |
| Immigrants | Costa Rica | 3.1 /100 | #229 | Tragic 97.6% |
| Senegalese | 3.1 /100 | #230 | Tragic 97.6% |
| Immigrants | Pakistan | 2.3 /100 | #231 | Tragic 97.6% |
| Immigrants | Western Asia | 2.1 /100 | #232 | Tragic 97.6% |