Immigrants from Lebanon vs Salvadoran Master's Degree
COMPARE
Immigrants from Lebanon
Salvadoran
Master's Degree
Master's Degree Comparison
Immigrants from Lebanon
Salvadorans
17.5%
MASTER'S DEGREE
99.6/ 100
METRIC RATING
79th/ 347
METRIC RANK
12.2%
MASTER'S DEGREE
0.3/ 100
METRIC RATING
270th/ 347
METRIC RANK
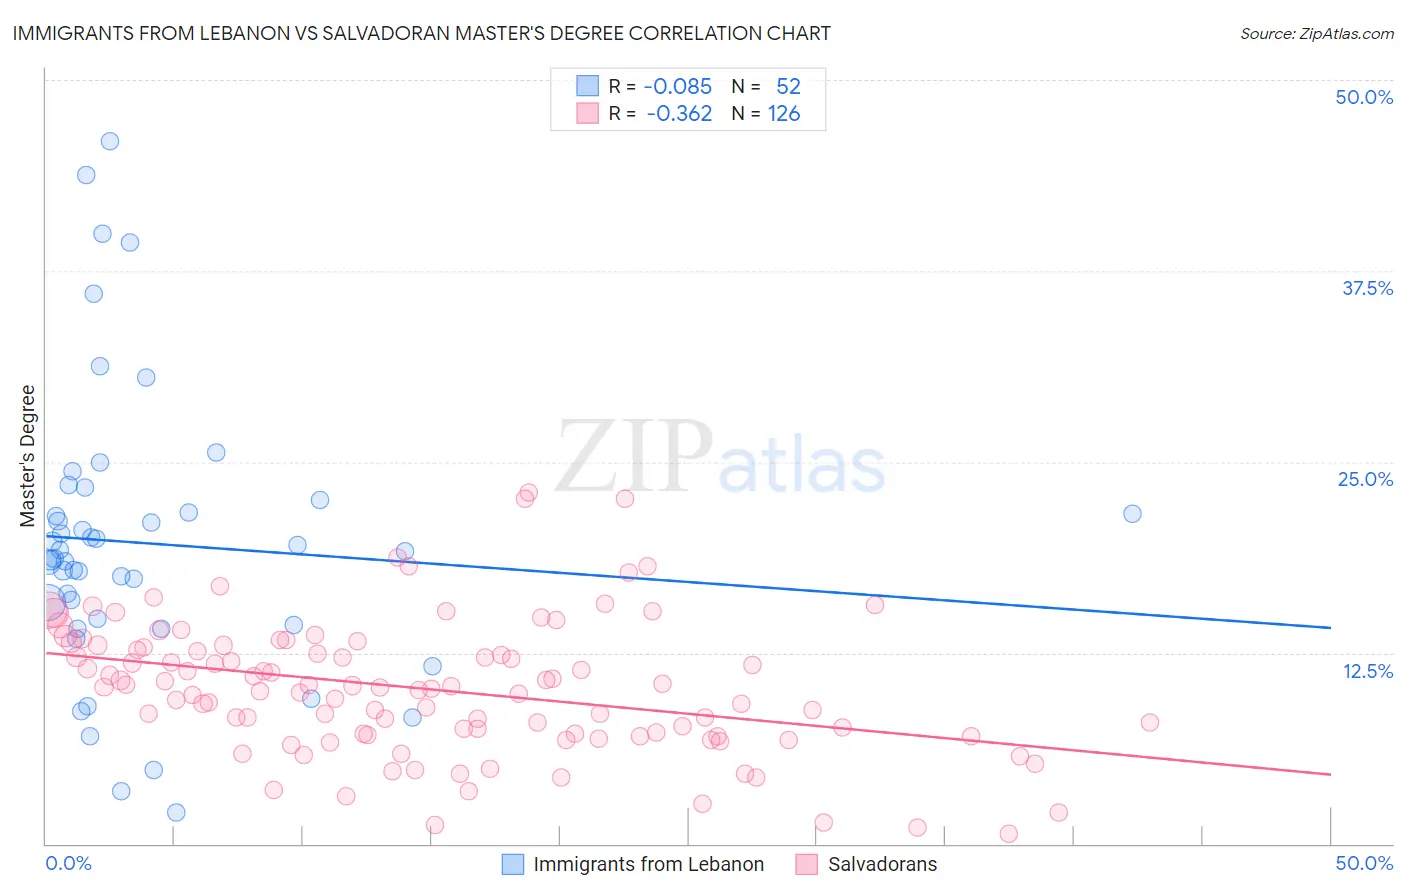
Immigrants from Lebanon vs Salvadoran Master's Degree Correlation Chart
The statistical analysis conducted on geographies consisting of 217,153,820 people shows a slight negative correlation between the proportion of Immigrants from Lebanon and percentage of population with at least master's degree education in the United States with a correlation coefficient (R) of -0.085 and weighted average of 17.5%. Similarly, the statistical analysis conducted on geographies consisting of 398,764,232 people shows a mild negative correlation between the proportion of Salvadorans and percentage of population with at least master's degree education in the United States with a correlation coefficient (R) of -0.362 and weighted average of 12.2%, a difference of 43.9%.
Master's Degree Correlation Summary
| Measurement | Immigrants from Lebanon | Salvadoran |
| Minimum | 2.0% | 0.69% |
| Maximum | 46.0% | 23.0% |
| Range | 43.9% | 22.3% |
| Mean | 19.7% | 10.1% |
| Median | 18.9% | 10.2% |
| Interquartile 25% (IQ1) | 14.5% | 7.1% |
| Interquartile 75% (IQ3) | 22.1% | 12.9% |
| Interquartile Range (IQR) | 7.6% | 5.7% |
| Standard Deviation (Sample) | 9.3% | 4.4% |
| Standard Deviation (Population) | 9.2% | 4.4% |
Similar Demographics by Master's Degree
Demographics Similar to Immigrants from Lebanon by Master's Degree
In terms of master's degree, the demographic groups most similar to Immigrants from Lebanon are Carpatho Rusyn (17.5%, a difference of 0.050%), Immigrants from Hungary (17.5%, a difference of 0.13%), Immigrants from Eastern Europe (17.6%, a difference of 0.33%), Immigrants from Western Asia (17.5%, a difference of 0.35%), and Greek (17.5%, a difference of 0.40%).
| Demographics | Rating | Rank | Master's Degree |
| Lithuanians | 99.7 /100 | #72 | Exceptional 17.7% |
| Zimbabweans | 99.7 /100 | #73 | Exceptional 17.7% |
| Immigrants | Romania | 99.7 /100 | #74 | Exceptional 17.7% |
| Egyptians | 99.6 /100 | #75 | Exceptional 17.6% |
| Immigrants | Indonesia | 99.6 /100 | #76 | Exceptional 17.6% |
| Immigrants | Eastern Europe | 99.6 /100 | #77 | Exceptional 17.6% |
| Immigrants | Hungary | 99.6 /100 | #78 | Exceptional 17.5% |
| Immigrants | Lebanon | 99.6 /100 | #79 | Exceptional 17.5% |
| Carpatho Rusyns | 99.6 /100 | #80 | Exceptional 17.5% |
| Immigrants | Western Asia | 99.5 /100 | #81 | Exceptional 17.5% |
| Greeks | 99.5 /100 | #82 | Exceptional 17.5% |
| Immigrants | Zimbabwe | 99.5 /100 | #83 | Exceptional 17.4% |
| Immigrants | Scotland | 99.4 /100 | #84 | Exceptional 17.4% |
| Immigrants | Brazil | 99.4 /100 | #85 | Exceptional 17.4% |
| Immigrants | Croatia | 99.3 /100 | #86 | Exceptional 17.3% |
Demographics Similar to Salvadorans by Master's Degree
In terms of master's degree, the demographic groups most similar to Salvadorans are Central American (12.2%, a difference of 0.13%), Haitian (12.1%, a difference of 0.59%), Comanche (12.1%, a difference of 0.64%), Blackfeet (12.1%, a difference of 0.74%), and Native Hawaiian (12.3%, a difference of 0.78%).
| Demographics | Rating | Rank | Master's Degree |
| Central American Indians | 0.5 /100 | #263 | Tragic 12.4% |
| Belizeans | 0.5 /100 | #264 | Tragic 12.4% |
| Immigrants | Fiji | 0.5 /100 | #265 | Tragic 12.4% |
| Bahamians | 0.5 /100 | #266 | Tragic 12.4% |
| Americans | 0.4 /100 | #267 | Tragic 12.3% |
| Native Hawaiians | 0.4 /100 | #268 | Tragic 12.3% |
| Central Americans | 0.3 /100 | #269 | Tragic 12.2% |
| Salvadorans | 0.3 /100 | #270 | Tragic 12.2% |
| Haitians | 0.3 /100 | #271 | Tragic 12.1% |
| Comanche | 0.3 /100 | #272 | Tragic 12.1% |
| Blackfeet | 0.3 /100 | #273 | Tragic 12.1% |
| Cape Verdeans | 0.3 /100 | #274 | Tragic 12.1% |
| Cubans | 0.3 /100 | #275 | Tragic 12.1% |
| Blacks/African Americans | 0.3 /100 | #276 | Tragic 12.1% |
| Immigrants | Caribbean | 0.3 /100 | #277 | Tragic 12.1% |