Immigrants from Lebanon vs Costa Rican 11th Grade
COMPARE
Immigrants from Lebanon
Costa Rican
11th Grade
11th Grade Comparison
Immigrants from Lebanon
Costa Ricans
92.7%
11TH GRADE
70.7/ 100
METRIC RATING
160th/ 347
METRIC RANK
91.9%
11TH GRADE
6.3/ 100
METRIC RATING
224th/ 347
METRIC RANK
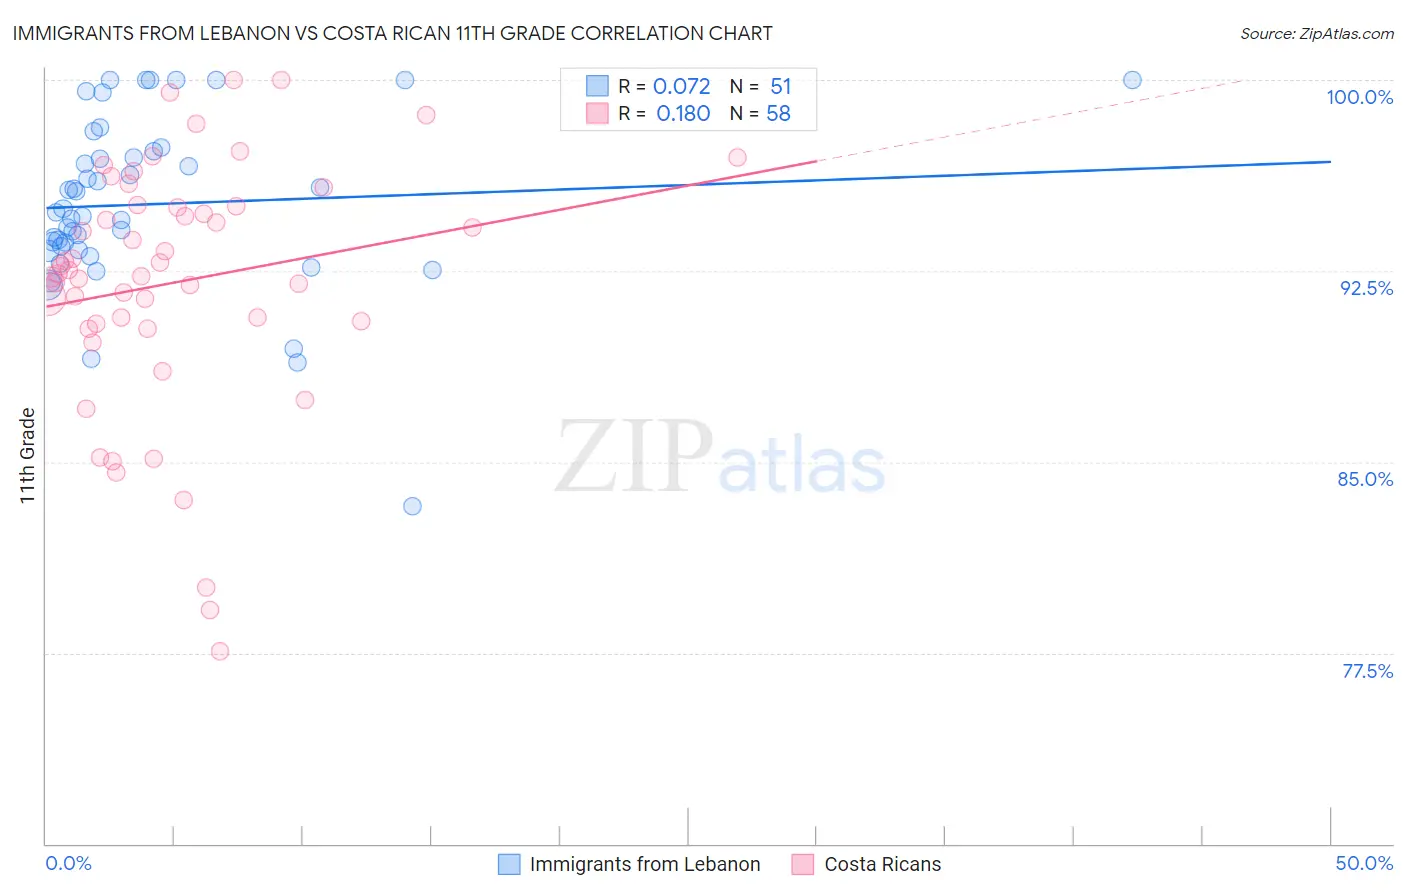
Immigrants from Lebanon vs Costa Rican 11th Grade Correlation Chart
The statistical analysis conducted on geographies consisting of 217,083,357 people shows a slight positive correlation between the proportion of Immigrants from Lebanon and percentage of population with at least 11th grade education in the United States with a correlation coefficient (R) of 0.072 and weighted average of 92.7%. Similarly, the statistical analysis conducted on geographies consisting of 253,601,730 people shows a poor positive correlation between the proportion of Costa Ricans and percentage of population with at least 11th grade education in the United States with a correlation coefficient (R) of 0.180 and weighted average of 91.9%, a difference of 0.89%.
11th Grade Correlation Summary
| Measurement | Immigrants from Lebanon | Costa Rican |
| Minimum | 83.3% | 77.5% |
| Maximum | 100.0% | 100.0% |
| Range | 16.7% | 22.5% |
| Mean | 95.1% | 92.0% |
| Median | 94.8% | 92.5% |
| Interquartile 25% (IQ1) | 93.3% | 90.4% |
| Interquartile 75% (IQ3) | 97.2% | 95.1% |
| Interquartile Range (IQR) | 3.9% | 4.6% |
| Standard Deviation (Sample) | 3.4% | 4.9% |
| Standard Deviation (Population) | 3.3% | 4.9% |
Similar Demographics by 11th Grade
Demographics Similar to Immigrants from Lebanon by 11th Grade
In terms of 11th grade, the demographic groups most similar to Immigrants from Lebanon are American (92.7%, a difference of 0.010%), Immigrants from Argentina (92.7%, a difference of 0.010%), Immigrants from Eastern Asia (92.7%, a difference of 0.020%), Immigrants from Venezuela (92.7%, a difference of 0.020%), and Paraguayan (92.7%, a difference of 0.020%).
| Demographics | Rating | Rank | 11th Grade |
| Brazilians | 73.9 /100 | #153 | Good 92.8% |
| Osage | 73.4 /100 | #154 | Good 92.7% |
| Argentineans | 73.4 /100 | #155 | Good 92.7% |
| Immigrants | Spain | 73.0 /100 | #156 | Good 92.7% |
| Immigrants | Eastern Asia | 72.6 /100 | #157 | Good 92.7% |
| Immigrants | Venezuela | 72.0 /100 | #158 | Good 92.7% |
| Americans | 71.7 /100 | #159 | Good 92.7% |
| Immigrants | Lebanon | 70.7 /100 | #160 | Good 92.7% |
| Immigrants | Argentina | 69.8 /100 | #161 | Good 92.7% |
| Paraguayans | 68.7 /100 | #162 | Good 92.7% |
| Immigrants | Nonimmigrants | 66.6 /100 | #163 | Good 92.7% |
| Spanish | 66.2 /100 | #164 | Good 92.7% |
| Immigrants | Iraq | 63.7 /100 | #165 | Good 92.6% |
| Bermudans | 62.3 /100 | #166 | Good 92.6% |
| Alsatians | 60.2 /100 | #167 | Good 92.6% |
Demographics Similar to Costa Ricans by 11th Grade
In terms of 11th grade, the demographic groups most similar to Costa Ricans are Immigrants from Africa (91.9%, a difference of 0.010%), Immigrants from Bahamas (91.9%, a difference of 0.010%), Immigrants from Liberia (91.9%, a difference of 0.030%), Immigrants from Zaire (91.9%, a difference of 0.040%), and South American Indian (92.0%, a difference of 0.050%).
| Demographics | Rating | Rank | 11th Grade |
| Immigrants | Sierra Leone | 11.1 /100 | #217 | Poor 92.0% |
| Blackfeet | 10.1 /100 | #218 | Poor 92.0% |
| Portuguese | 10.0 /100 | #219 | Tragic 92.0% |
| South American Indians | 7.6 /100 | #220 | Tragic 92.0% |
| Immigrants | Liberia | 7.0 /100 | #221 | Tragic 91.9% |
| Immigrants | Africa | 6.5 /100 | #222 | Tragic 91.9% |
| Immigrants | Bahamas | 6.5 /100 | #223 | Tragic 91.9% |
| Costa Ricans | 6.3 /100 | #224 | Tragic 91.9% |
| Immigrants | Zaire | 5.4 /100 | #225 | Tragic 91.9% |
| Immigrants | Somalia | 5.2 /100 | #226 | Tragic 91.9% |
| Immigrants | Cameroon | 4.4 /100 | #227 | Tragic 91.8% |
| Immigrants | Panama | 4.3 /100 | #228 | Tragic 91.8% |
| Nigerians | 4.3 /100 | #229 | Tragic 91.8% |
| Immigrants | Afghanistan | 3.9 /100 | #230 | Tragic 91.8% |
| Choctaw | 3.7 /100 | #231 | Tragic 91.8% |