Immigrants from Latvia vs Immigrants from Senegal College, Under 1 year

COMPARE

Immigrants from Latvia
Race
Ancestry
AfghanAfricanAlaska NativeAlaskan AthabascanAlbanianAleutAlsatianAmericanApacheArabArapahoArgentineanArmenianAssyrian/Chaldean/SyriacAustralianAustrianBahamianBangladeshiBarbadianBasqueBelgianBelizeanBermudanBhutaneseBlackfeetBolivianBrazilianBritishBritish West IndianBulgarianBurmeseCajunCambodianCanadianCape VerdeanCarpatho RusynCelticCentral AmericanCentral American IndianCherokeeCheyenneChickasawChileanChineseChippewaChoctawColombianColvilleComancheCosta RicanCreeCreekCroatianCrowCubanCypriotCzechCzechoslovakianDanishDelawareDominicanDutchDutch West IndianEastern EuropeanEcuadorianEgyptianEnglishEstonianEthiopianEuropeanFijianFilipinoFinnishFrenchFrench American IndianFrench CanadianGermanGerman RussianGhanaianGreekGuamanian/ChamorroGuatemalanGuyaneseHaitianHmongHonduranHopiHoumaHungarianIcelanderIndian (Asian)IndonesianInupiatIranianIraqiIrishIroquoisIsraeliItalianJamaicanJapaneseJordanianKenyanKiowaKoreanLaotianLatvianLebaneseLiberianLithuanianLumbeeLuxembourgerMacedonianMalaysianMalteseMarshalleseMenomineeMexicanMexican American IndianMongolianMoroccanNative HawaiianNavajoNepaleseNew ZealanderNicaraguanNigerianNorthern EuropeanNorwegianOkinawanOsageOttawaPaiutePakistaniPalestinianPanamanianParaguayanPennsylvania GermanPeruvianPimaPolishPortuguesePotawatomiPuebloPuerto RicanPuget Sound SalishRomanianRussianSalvadoranSamoanScandinavianScotch-IrishScottishSeminoleSenegaleseSerbianShoshoneSierra LeoneanSiouxSlavicSlovakSloveneSomaliSouth AfricanSouth AmericanSouth American IndianSoviet UnionSpaniardSpanishSpanish AmericanSpanish American IndianSri LankanSubsaharan AfricanSudaneseSwedishSwissSyrianTaiwaneseThaiTlingit-HaidaTohono O'OdhamTonganTrinidadian and TobagonianTsimshianTurkishU.S. Virgin IslanderUgandanUkrainianUruguayanUteVenezuelanVietnameseWelshWest IndianYakamaYaquiYugoslavianYumanYup'ikZimbabwean
Immigration
NonimmigrantsImmigrantsAfghanistanAfricaAlbaniaArgentinaArmeniaAsiaAustraliaAustriaBahamasBangladeshBarbadosBelarusBelgiumBelizeBoliviaBosnia and HerzegovinaBrazilBulgariaBurma/MyanmarCabo VerdeCambodiaCameroonCanadaCaribbeanCentral AmericaChileChinaColombiaCongoCosta RicaCroatiaCubaCzechoslovakiaDenmarkDominicaDominican RepublicEastern AfricaEastern AsiaEastern EuropeEcuadorEgyptEl SalvadorEnglandEritreaEthiopiaEuropeFijiFranceGermanyGhanaGreeceGrenadaGuatemalaGuyanaHaitiHondurasHong KongHungaryIndiaIndonesiaIranIraqIrelandIsraelItalyJamaicaJapanJordanKazakhstanKenyaKoreaKuwaitLaosLatin AmericaLatviaLebanonLiberiaLithuaniaMalaysiaMexicoMicronesiaMiddle AfricaMoldovaMoroccoNepalNetherlandsNicaraguaNigeriaNorth AmericaNorth MacedoniaNorthern AfricaNorthern EuropeNorwayOceaniaPakistanPanamaPeruPhilippinesPolandPortugalRomaniaRussiaSaudi ArabiaScotlandSerbiaSierra LeoneSingaporeSomaliaSouth AfricaSouth AmericaSouth Central AsiaSouth Eastern AsiaSouthern EuropeSpainSri LankaSt. Vincent and the GrenadinesSudanSwedenSwitzerlandSyriaTaiwanThailandTrinidad and TobagoTurkeyUgandaUkraineUruguayUzbekistanVenezuelaVietnamWest IndiesWestern AfricaWestern AsiaWestern EuropeYemenZaireZimbabweAzores
Immigrants from Senegal
Race
Ancestry
AfghanAfricanAlaska NativeAlaskan AthabascanAlbanianAleutAlsatianAmericanApacheArabArapahoArgentineanArmenianAssyrian/Chaldean/SyriacAustralianAustrianBahamianBangladeshiBarbadianBasqueBelgianBelizeanBermudanBhutaneseBlackfeetBolivianBrazilianBritishBritish West IndianBulgarianBurmeseCajunCambodianCanadianCape VerdeanCarpatho RusynCelticCentral AmericanCentral American IndianCherokeeCheyenneChickasawChileanChineseChippewaChoctawColombianColvilleComancheCosta RicanCreeCreekCroatianCrowCubanCypriotCzechCzechoslovakianDanishDelawareDominicanDutchDutch West IndianEastern EuropeanEcuadorianEgyptianEnglishEstonianEthiopianEuropeanFijianFilipinoFinnishFrenchFrench American IndianFrench CanadianGermanGerman RussianGhanaianGreekGuamanian/ChamorroGuatemalanGuyaneseHaitianHmongHonduranHopiHoumaHungarianIcelanderIndian (Asian)IndonesianInupiatIranianIraqiIrishIroquoisIsraeliItalianJamaicanJapaneseJordanianKenyanKiowaKoreanLaotianLatvianLebaneseLiberianLithuanianLumbeeLuxembourgerMacedonianMalaysianMalteseMarshalleseMenomineeMexicanMexican American IndianMongolianMoroccanNative HawaiianNavajoNepaleseNew ZealanderNicaraguanNigerianNorthern EuropeanNorwegianOkinawanOsageOttawaPaiutePakistaniPalestinianPanamanianParaguayanPennsylvania GermanPeruvianPimaPolishPortuguesePotawatomiPuebloPuerto RicanPuget Sound SalishRomanianRussianSalvadoranSamoanScandinavianScotch-IrishScottishSeminoleSenegaleseSerbianShoshoneSierra LeoneanSiouxSlavicSlovakSloveneSomaliSouth AfricanSouth AmericanSouth American IndianSoviet UnionSpaniardSpanishSpanish AmericanSpanish American IndianSri LankanSubsaharan AfricanSudaneseSwedishSwissSyrianTaiwaneseThaiTlingit-HaidaTohono O'OdhamTonganTrinidadian and TobagonianTsimshianTurkishU.S. Virgin IslanderUgandanUkrainianUruguayanUteVenezuelanVietnameseWelshWest IndianYakamaYaquiYugoslavianYumanYup'ikZimbabwean
Immigration
NonimmigrantsImmigrantsAfghanistanAfricaAlbaniaArgentinaArmeniaAsiaAustraliaAustriaBahamasBangladeshBarbadosBelarusBelgiumBelizeBoliviaBosnia and HerzegovinaBrazilBulgariaBurma/MyanmarCabo VerdeCambodiaCameroonCanadaCaribbeanCentral AmericaChileChinaColombiaCongoCosta RicaCroatiaCubaCzechoslovakiaDenmarkDominicaDominican RepublicEastern AfricaEastern AsiaEastern EuropeEcuadorEgyptEl SalvadorEnglandEritreaEthiopiaEuropeFijiFranceGermanyGhanaGreeceGrenadaGuatemalaGuyanaHaitiHondurasHong KongHungaryIndiaIndonesiaIranIraqIrelandIsraelItalyJamaicaJapanJordanKazakhstanKenyaKoreaKuwaitLaosLatin AmericaLebanonLiberiaLithuaniaMalaysiaMexicoMicronesiaMiddle AfricaMoldovaMoroccoNepalNetherlandsNicaraguaNigeriaNorth AmericaNorth MacedoniaNorthern AfricaNorthern EuropeNorwayOceaniaPakistanPanamaPeruPhilippinesPolandPortugalRomaniaRussiaSaudi ArabiaScotlandSenegalSerbiaSierra LeoneSingaporeSomaliaSouth AfricaSouth AmericaSouth Central AsiaSouth Eastern AsiaSouthern EuropeSpainSri LankaSt. Vincent and the GrenadinesSudanSwedenSwitzerlandSyriaTaiwanThailandTrinidad and TobagoTurkeyUgandaUkraineUruguayUzbekistanVenezuelaVietnamWest IndiesWestern AfricaWestern AsiaWestern EuropeYemenZaireZimbabweAzores
College, Under 1 year
Income
Poverty
Unemployment
Labor Participation
Family Structure
Vehicle Availability
Education Level
Disability

College, Under 1 year Comparison

Immigrants from Latvia

Immigrants from Senegal

Exceptional
Tragic
70.1%
COLLEGE, UNDER 1 YEAR
99.9/ 100
METRIC RATING
46th/ 347
METRIC RANK
63.3%
COLLEGE, UNDER 1 YEAR
5.0/ 100
METRIC RATING
222nd/ 347
METRIC RANK

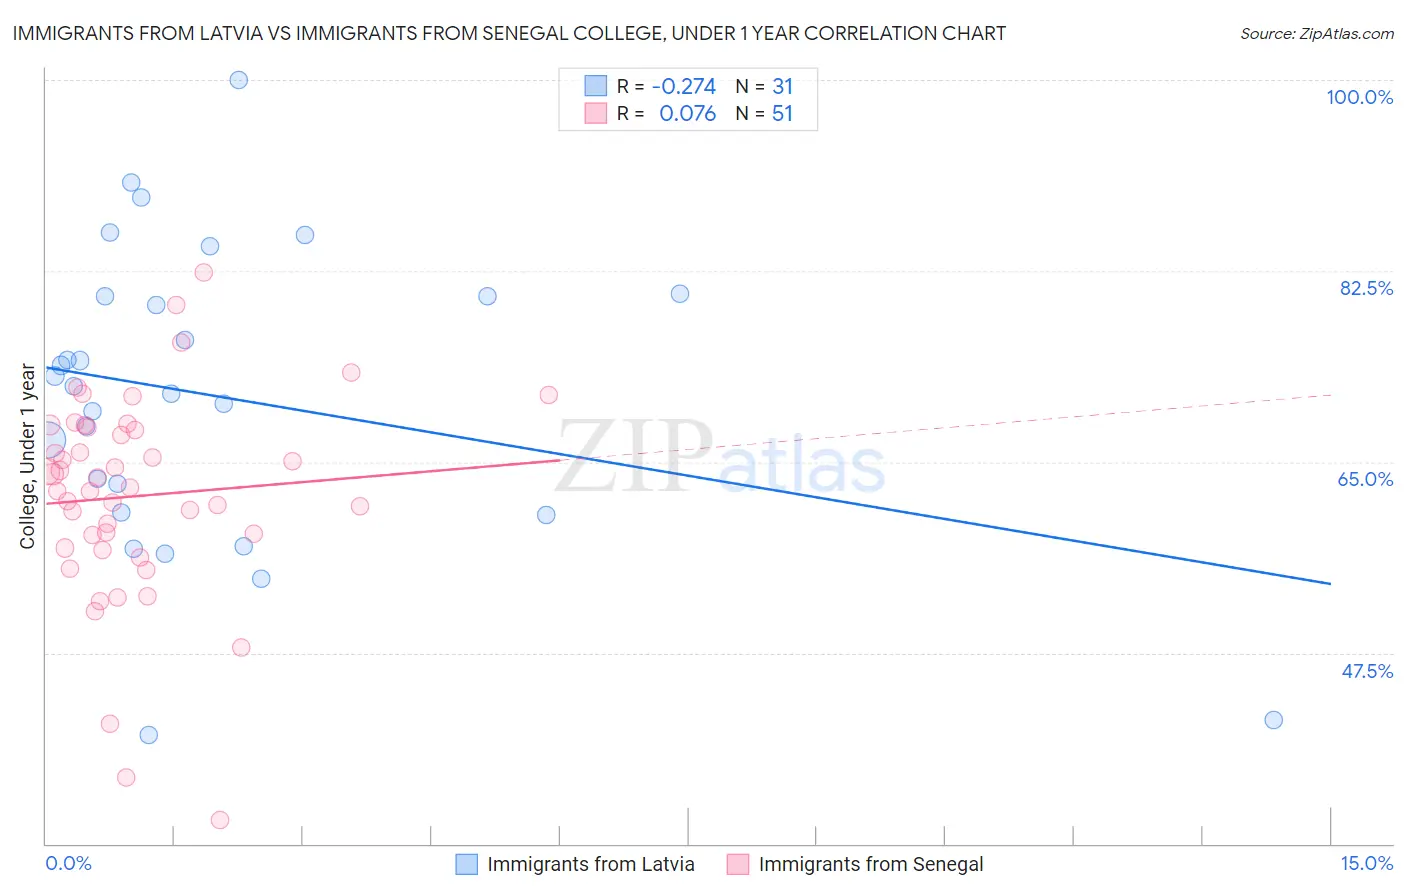
Immigrants from Latvia vs Immigrants from Senegal College, Under 1 year Correlation Chart

The statistical analysis conducted on geographies consisting of 113,735,345 people shows a weak negative correlation between the proportion of Immigrants from Latvia and percentage of population with at least college, under 1 year education in the United States with a correlation coefficient (R) of -0.274 and weighted average of 70.1%. Similarly, the statistical analysis conducted on geographies consisting of 90,129,295 people shows a slight positive correlation between the proportion of Immigrants from Senegal and percentage of population with at least college, under 1 year education in the United States with a correlation coefficient (R) of 0.076 and weighted average of 63.3%, a difference of 10.8%.
Immigrants from Latvia vs Immigrants from Senegal College, Under 1 year

College, Under 1 year Correlation Summary

MeasurementImmigrants from LatviaImmigrants from Senegal
Minimum40.0%32.1%
Maximum100.0%82.4%
Range60.0%50.2%
Mean71.0%61.9%
Median71.9%62.6%
Interquartile 25% (IQ1)60.4%57.1%
Interquartile 75% (IQ3)80.2%68.1%
Interquartile Range (IQR)19.8%11.0%
Standard Deviation (Sample)13.7%9.5%
Standard Deviation (Population)13.5%9.4%

Similar Demographics by College, Under 1 year

Demographics Similar to Immigrants from Latvia by College, Under 1 year

In terms of college, under 1 year, the demographic groups most similar to Immigrants from Latvia are Immigrants from Bulgaria (70.0%, a difference of 0.11%), Immigrants from Norway (70.2%, a difference of 0.12%), Israeli (70.2%, a difference of 0.14%), New Zealander (70.2%, a difference of 0.14%), and Immigrants from Netherlands (70.0%, a difference of 0.17%).
DemographicsRating | RankCollege, Under 1 year
Bhutanese
99.9
/100
|
#39
Exceptional
70.3%
Immigrants | Turkey
99.9
/100
|
#40
Exceptional
70.3%
Immigrants | Kuwait
99.9
/100
|
#41
Exceptional
70.3%
Immigrants | Lithuania
99.9
/100
|
#42
Exceptional
70.3%
Israelis
99.9
/100
|
#43
Exceptional
70.2%
New Zealanders
99.9
/100
|
#44
Exceptional
70.2%
Immigrants | Norway
99.9
/100
|
#45
Exceptional
70.2%
Immigrants | Latvia
99.9
/100
|
#46
Exceptional
70.1%
Immigrants | Bulgaria
99.8
/100
|
#47
Exceptional
70.0%
Immigrants | Netherlands
99.8
/100
|
#48
Exceptional
70.0%
Immigrants | Austria
99.8
/100
|
#49
Exceptional
70.0%
Zimbabweans
99.8
/100
|
#50
Exceptional
69.9%
Mongolians
99.8
/100
|
#51
Exceptional
69.9%
Immigrants | Russia
99.8
/100
|
#52
Exceptional
69.9%
South Africans
99.7
/100
|
#53
Exceptional
69.7%

Demographics Similar to Immigrants from Senegal by College, Under 1 year

In terms of college, under 1 year, the demographic groups most similar to Immigrants from Senegal are Cree (63.3%, a difference of 0.050%), Immigrants from Costa Rica (63.2%, a difference of 0.12%), Portuguese (63.4%, a difference of 0.14%), Subsaharan African (63.2%, a difference of 0.15%), and Immigrants from Panama (63.4%, a difference of 0.16%).
DemographicsRating | RankCollege, Under 1 year
Senegalese
7.7
/100
|
#215
Tragic
63.6%
Hmong
6.8
/100
|
#216
Tragic
63.5%
Immigrants | Uruguay
5.8
/100
|
#217
Tragic
63.4%
Immigrants | Panama
5.7
/100
|
#218
Tragic
63.4%
Immigrants | Fiji
5.7
/100
|
#219
Tragic
63.4%
Portuguese
5.6
/100
|
#220
Tragic
63.4%
Cree
5.2
/100
|
#221
Tragic
63.3%
Immigrants | Senegal
5.0
/100
|
#222
Tragic
63.3%
Immigrants | Costa Rica
4.5
/100
|
#223
Tragic
63.2%
Sub-Saharan Africans
4.4
/100
|
#224
Tragic
63.2%
Immigrants | Peru
4.0
/100
|
#225
Tragic
63.1%
Immigrants | Colombia
4.0
/100
|
#226
Tragic
63.1%
Immigrants | Ghana
3.7
/100
|
#227
Tragic
63.1%
Samoans
3.3
/100
|
#228
Tragic
63.0%
Liberians
3.2
/100
|
#229
Tragic
63.0%