Immigrants from Latvia vs Immigrants from Eritrea 1st Grade

COMPARE

Immigrants from Latvia
Race
Ancestry
AfghanAfricanAlaska NativeAlaskan AthabascanAlbanianAleutAlsatianAmericanApacheArabArapahoArgentineanArmenianAssyrian/Chaldean/SyriacAustralianAustrianBahamianBangladeshiBarbadianBasqueBelgianBelizeanBermudanBhutaneseBlackfeetBolivianBrazilianBritishBritish West IndianBulgarianBurmeseCajunCambodianCanadianCape VerdeanCarpatho RusynCelticCentral AmericanCentral American IndianCherokeeCheyenneChickasawChileanChineseChippewaChoctawColombianColvilleComancheCosta RicanCreeCreekCroatianCrowCubanCypriotCzechCzechoslovakianDanishDelawareDominicanDutchDutch West IndianEastern EuropeanEcuadorianEgyptianEnglishEstonianEthiopianEuropeanFijianFilipinoFinnishFrenchFrench American IndianFrench CanadianGermanGerman RussianGhanaianGreekGuamanian/ChamorroGuatemalanGuyaneseHaitianHmongHonduranHopiHoumaHungarianIcelanderIndian (Asian)IndonesianInupiatIranianIraqiIrishIroquoisIsraeliItalianJamaicanJapaneseJordanianKenyanKiowaKoreanLaotianLatvianLebaneseLiberianLithuanianLumbeeLuxembourgerMacedonianMalaysianMalteseMarshalleseMenomineeMexicanMexican American IndianMongolianMoroccanNative HawaiianNavajoNepaleseNew ZealanderNicaraguanNigerianNorthern EuropeanNorwegianOkinawanOsageOttawaPaiutePakistaniPalestinianPanamanianParaguayanPennsylvania GermanPeruvianPimaPolishPortuguesePotawatomiPuebloPuerto RicanPuget Sound SalishRomanianRussianSalvadoranSamoanScandinavianScotch-IrishScottishSeminoleSenegaleseSerbianShoshoneSierra LeoneanSiouxSlavicSlovakSloveneSomaliSouth AfricanSouth AmericanSouth American IndianSoviet UnionSpaniardSpanishSpanish AmericanSpanish American IndianSri LankanSubsaharan AfricanSudaneseSwedishSwissSyrianTaiwaneseThaiTlingit-HaidaTohono O'OdhamTonganTrinidadian and TobagonianTsimshianTurkishU.S. Virgin IslanderUgandanUkrainianUruguayanUteVenezuelanVietnameseWelshWest IndianYakamaYaquiYugoslavianYumanYup'ikZimbabwean
Immigration
NonimmigrantsImmigrantsAfghanistanAfricaAlbaniaArgentinaArmeniaAsiaAustraliaAustriaBahamasBangladeshBarbadosBelarusBelgiumBelizeBoliviaBosnia and HerzegovinaBrazilBulgariaBurma/MyanmarCabo VerdeCambodiaCameroonCanadaCaribbeanCentral AmericaChileChinaColombiaCongoCosta RicaCroatiaCubaCzechoslovakiaDenmarkDominicaDominican RepublicEastern AfricaEastern AsiaEastern EuropeEcuadorEgyptEl SalvadorEnglandEthiopiaEuropeFijiFranceGermanyGhanaGreeceGrenadaGuatemalaGuyanaHaitiHondurasHong KongHungaryIndiaIndonesiaIranIraqIrelandIsraelItalyJamaicaJapanJordanKazakhstanKenyaKoreaKuwaitLaosLatin AmericaLatviaLebanonLiberiaLithuaniaMalaysiaMexicoMicronesiaMiddle AfricaMoldovaMoroccoNepalNetherlandsNicaraguaNigeriaNorth AmericaNorth MacedoniaNorthern AfricaNorthern EuropeNorwayOceaniaPakistanPanamaPeruPhilippinesPolandPortugalRomaniaRussiaSaudi ArabiaScotlandSenegalSerbiaSierra LeoneSingaporeSomaliaSouth AfricaSouth AmericaSouth Central AsiaSouth Eastern AsiaSouthern EuropeSpainSri LankaSt. Vincent and the GrenadinesSudanSwedenSwitzerlandSyriaTaiwanThailandTrinidad and TobagoTurkeyUgandaUkraineUruguayUzbekistanVenezuelaVietnamWest IndiesWestern AfricaWestern AsiaWestern EuropeYemenZaireZimbabweAzores
Immigrants from Eritrea
Race
Ancestry
AfghanAfricanAlaska NativeAlaskan AthabascanAlbanianAleutAlsatianAmericanApacheArabArapahoArgentineanArmenianAssyrian/Chaldean/SyriacAustralianAustrianBahamianBangladeshiBarbadianBasqueBelgianBelizeanBermudanBhutaneseBlackfeetBolivianBrazilianBritishBritish West IndianBulgarianBurmeseCajunCambodianCanadianCape VerdeanCarpatho RusynCelticCentral AmericanCentral American IndianCherokeeCheyenneChickasawChileanChineseChippewaChoctawColombianColvilleComancheCosta RicanCreeCreekCroatianCrowCubanCypriotCzechCzechoslovakianDanishDelawareDominicanDutchDutch West IndianEastern EuropeanEcuadorianEgyptianEnglishEstonianEthiopianEuropeanFijianFilipinoFinnishFrenchFrench American IndianFrench CanadianGermanGerman RussianGhanaianGreekGuamanian/ChamorroGuatemalanGuyaneseHaitianHmongHonduranHopiHoumaHungarianIcelanderIndian (Asian)IndonesianInupiatIranianIraqiIrishIroquoisIsraeliItalianJamaicanJapaneseJordanianKenyanKiowaKoreanLaotianLatvianLebaneseLiberianLithuanianLumbeeLuxembourgerMacedonianMalaysianMalteseMarshalleseMenomineeMexicanMexican American IndianMongolianMoroccanNative HawaiianNavajoNepaleseNew ZealanderNicaraguanNigerianNorthern EuropeanNorwegianOkinawanOsageOttawaPaiutePakistaniPalestinianPanamanianParaguayanPennsylvania GermanPeruvianPimaPolishPortuguesePotawatomiPuebloPuerto RicanPuget Sound SalishRomanianRussianSalvadoranSamoanScandinavianScotch-IrishScottishSeminoleSenegaleseSerbianShoshoneSierra LeoneanSiouxSlavicSlovakSloveneSomaliSouth AfricanSouth AmericanSouth American IndianSoviet UnionSpaniardSpanishSpanish AmericanSpanish American IndianSri LankanSubsaharan AfricanSudaneseSwedishSwissSyrianTaiwaneseThaiTlingit-HaidaTohono O'OdhamTonganTrinidadian and TobagonianTsimshianTurkishU.S. Virgin IslanderUgandanUkrainianUruguayanUteVenezuelanVietnameseWelshWest IndianYakamaYaquiYugoslavianYumanYup'ikZimbabwean
Immigration
NonimmigrantsImmigrantsAfghanistanAfricaAlbaniaArgentinaArmeniaAsiaAustraliaAustriaBahamasBangladeshBarbadosBelarusBelgiumBelizeBoliviaBosnia and HerzegovinaBrazilBulgariaBurma/MyanmarCabo VerdeCambodiaCameroonCanadaCaribbeanCentral AmericaChileChinaColombiaCongoCosta RicaCroatiaCubaCzechoslovakiaDenmarkDominicaDominican RepublicEastern AfricaEastern AsiaEastern EuropeEcuadorEgyptEl SalvadorEnglandEritreaEthiopiaEuropeFijiFranceGermanyGhanaGreeceGrenadaGuatemalaGuyanaHaitiHondurasHong KongHungaryIndiaIndonesiaIranIraqIrelandIsraelItalyJamaicaJapanJordanKazakhstanKenyaKoreaKuwaitLaosLatin AmericaLebanonLiberiaLithuaniaMalaysiaMexicoMicronesiaMiddle AfricaMoldovaMoroccoNepalNetherlandsNicaraguaNigeriaNorth AmericaNorth MacedoniaNorthern AfricaNorthern EuropeNorwayOceaniaPakistanPanamaPeruPhilippinesPolandPortugalRomaniaRussiaSaudi ArabiaScotlandSenegalSerbiaSierra LeoneSingaporeSomaliaSouth AfricaSouth AmericaSouth Central AsiaSouth Eastern AsiaSouthern EuropeSpainSri LankaSt. Vincent and the GrenadinesSudanSwedenSwitzerlandSyriaTaiwanThailandTrinidad and TobagoTurkeyUgandaUkraineUruguayUzbekistanVenezuelaVietnamWest IndiesWestern AfricaWestern AsiaWestern EuropeYemenZaireZimbabweAzores
1st Grade
Income
Poverty
Unemployment
Labor Participation
Family Structure
Vehicle Availability
Education Level
Disability

1st Grade Comparison

Immigrants from Latvia

Immigrants from Eritrea

Exceptional
Tragic
98.2%
1ST GRADE
96.4/ 100
METRIC RATING
113th/ 347
METRIC RANK
97.2%
1ST GRADE
0.0/ 100
METRIC RATING
296th/ 347
METRIC RANK

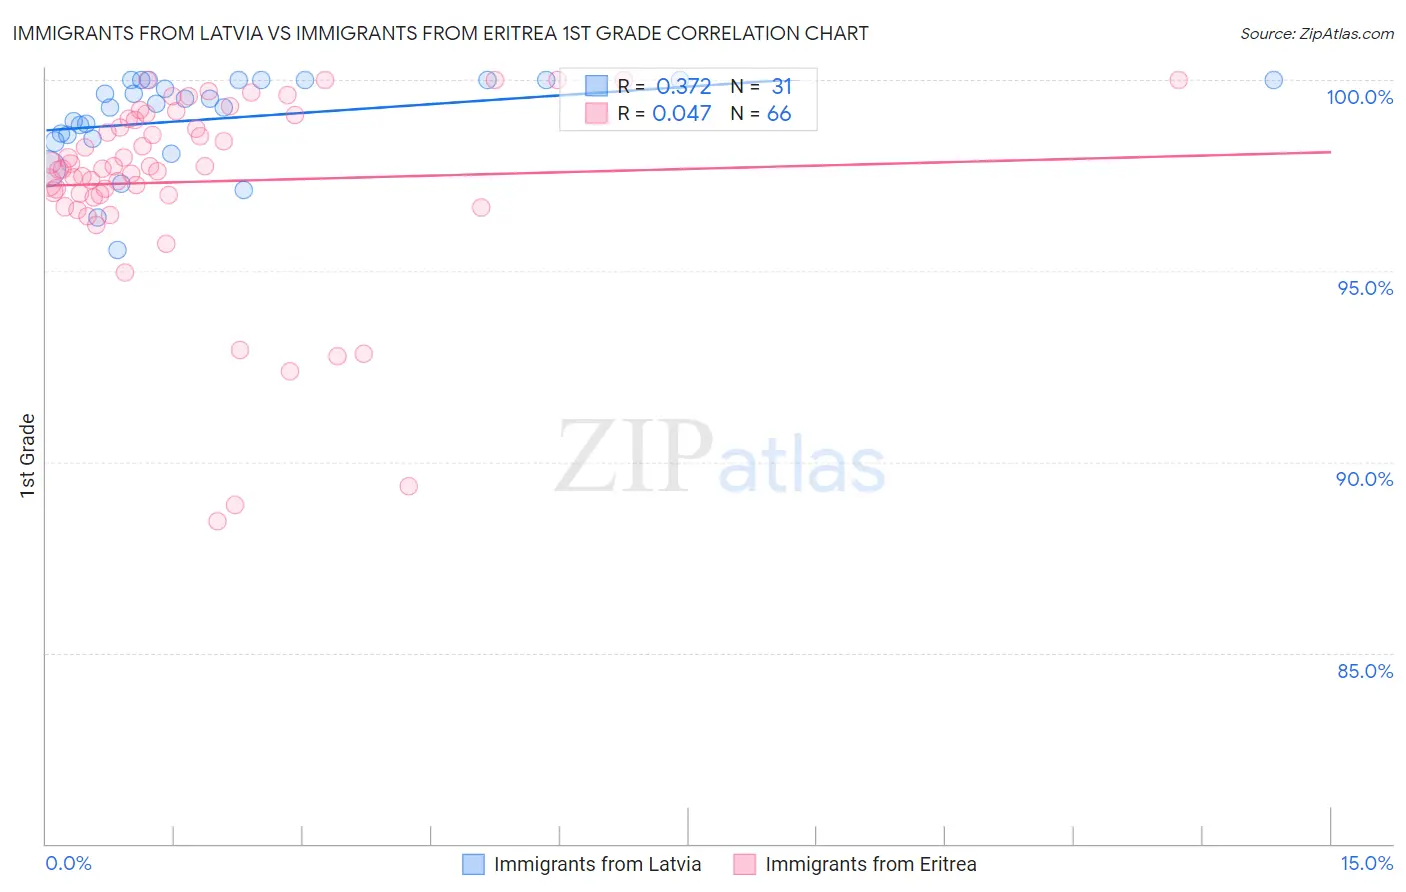
Immigrants from Latvia vs Immigrants from Eritrea 1st Grade Correlation Chart

The statistical analysis conducted on geographies consisting of 113,735,345 people shows a mild positive correlation between the proportion of Immigrants from Latvia and percentage of population with at least 1st grade education in the United States with a correlation coefficient (R) of 0.372 and weighted average of 98.2%. Similarly, the statistical analysis conducted on geographies consisting of 104,853,741 people shows no correlation between the proportion of Immigrants from Eritrea and percentage of population with at least 1st grade education in the United States with a correlation coefficient (R) of 0.047 and weighted average of 97.2%, a difference of 1.0%.
Immigrants from Latvia vs Immigrants from Eritrea 1st Grade

1st Grade Correlation Summary

MeasurementImmigrants from LatviaImmigrants from Eritrea
Minimum95.5%88.5%
Maximum100.0%100.0%
Range4.5%11.5%
Mean99.0%97.3%
Median99.4%97.7%
Interquartile 25% (IQ1)98.5%97.0%
Interquartile 75% (IQ3)100.0%99.0%
Interquartile Range (IQR)1.5%2.0%
Standard Deviation (Sample)1.2%2.5%
Standard Deviation (Population)1.2%2.5%

Similar Demographics by 1st Grade

Demographics Similar to Immigrants from Latvia by 1st Grade

In terms of 1st grade, the demographic groups most similar to Immigrants from Latvia are Immigrants from Norway (98.2%, a difference of 0.0%), Ute (98.2%, a difference of 0.0%), Immigrants from Singapore (98.2%, a difference of 0.010%), Immigrants from Czechoslovakia (98.2%, a difference of 0.010%), and Iranian (98.2%, a difference of 0.010%).
DemographicsRating | Rank1st Grade
Turks
97.4
/100
|
#106
Exceptional
98.2%
Immigrants | Switzerland
97.3
/100
|
#107
Exceptional
98.2%
Bhutanese
97.3
/100
|
#108
Exceptional
98.2%
German Russians
97.1
/100
|
#109
Exceptional
98.2%
Immigrants | Singapore
96.7
/100
|
#110
Exceptional
98.2%
Immigrants | Czechoslovakia
96.6
/100
|
#111
Exceptional
98.2%
Immigrants | Norway
96.6
/100
|
#112
Exceptional
98.2%
Immigrants | Latvia
96.4
/100
|
#113
Exceptional
98.2%
Ute
96.2
/100
|
#114
Exceptional
98.2%
Iranians
96.0
/100
|
#115
Exceptional
98.2%
Spanish
95.9
/100
|
#116
Exceptional
98.2%
Yugoslavians
95.5
/100
|
#117
Exceptional
98.2%
Immigrants | France
95.5
/100
|
#118
Exceptional
98.2%
Thais
94.7
/100
|
#119
Exceptional
98.1%
Okinawans
94.5
/100
|
#120
Exceptional
98.1%

Demographics Similar to Immigrants from Eritrea by 1st Grade

In terms of 1st grade, the demographic groups most similar to Immigrants from Eritrea are Immigrants (97.2%, a difference of 0.0%), Immigrants from Grenada (97.2%, a difference of 0.010%), Malaysian (97.2%, a difference of 0.030%), British West Indian (97.2%, a difference of 0.050%), and Central American Indian (97.1%, a difference of 0.050%).
DemographicsRating | Rank1st Grade
Immigrants | Afghanistan
0.0
/100
|
#289
Tragic
97.3%
Immigrants | St. Vincent and the Grenadines
0.0
/100
|
#290
Tragic
97.3%
Houma
0.0
/100
|
#291
Tragic
97.2%
British West Indians
0.0
/100
|
#292
Tragic
97.2%
Malaysians
0.0
/100
|
#293
Tragic
97.2%
Immigrants | Grenada
0.0
/100
|
#294
Tragic
97.2%
Immigrants | Immigrants
0.0
/100
|
#295
Tragic
97.2%
Immigrants | Eritrea
0.0
/100
|
#296
Tragic
97.2%
Central American Indians
0.0
/100
|
#297
Tragic
97.1%
Immigrants | Dominica
0.0
/100
|
#298
Tragic
97.1%
Immigrants | Cuba
0.0
/100
|
#299
Tragic
97.1%
Haitians
0.0
/100
|
#300
Tragic
97.1%
Immigrants | South Eastern Asia
0.0
/100
|
#301
Tragic
97.1%
Immigrants | Caribbean
0.0
/100
|
#302
Tragic
97.0%
Somalis
0.0
/100
|
#303
Tragic
97.0%