Immigrants from Latvia vs Immigrants from Cabo Verde College, 1 year or more

COMPARE

Immigrants from Latvia
Race
Ancestry
AfghanAfricanAlaska NativeAlaskan AthabascanAlbanianAleutAlsatianAmericanApacheArabArapahoArgentineanArmenianAssyrian/Chaldean/SyriacAustralianAustrianBahamianBangladeshiBarbadianBasqueBelgianBelizeanBermudanBhutaneseBlackfeetBolivianBrazilianBritishBritish West IndianBulgarianBurmeseCajunCambodianCanadianCape VerdeanCarpatho RusynCelticCentral AmericanCentral American IndianCherokeeCheyenneChickasawChileanChineseChippewaChoctawColombianColvilleComancheCosta RicanCreeCreekCroatianCrowCubanCypriotCzechCzechoslovakianDanishDelawareDominicanDutchDutch West IndianEastern EuropeanEcuadorianEgyptianEnglishEstonianEthiopianEuropeanFijianFilipinoFinnishFrenchFrench American IndianFrench CanadianGermanGerman RussianGhanaianGreekGuamanian/ChamorroGuatemalanGuyaneseHaitianHmongHonduranHopiHoumaHungarianIcelanderIndian (Asian)IndonesianInupiatIranianIraqiIrishIroquoisIsraeliItalianJamaicanJapaneseJordanianKenyanKiowaKoreanLaotianLatvianLebaneseLiberianLithuanianLumbeeLuxembourgerMacedonianMalaysianMalteseMarshalleseMenomineeMexicanMexican American IndianMongolianMoroccanNative HawaiianNavajoNepaleseNew ZealanderNicaraguanNigerianNorthern EuropeanNorwegianOkinawanOsageOttawaPaiutePakistaniPalestinianPanamanianParaguayanPennsylvania GermanPeruvianPimaPolishPortuguesePotawatomiPuebloPuerto RicanPuget Sound SalishRomanianRussianSalvadoranSamoanScandinavianScotch-IrishScottishSeminoleSenegaleseSerbianShoshoneSierra LeoneanSiouxSlavicSlovakSloveneSomaliSouth AfricanSouth AmericanSouth American IndianSoviet UnionSpaniardSpanishSpanish AmericanSpanish American IndianSri LankanSubsaharan AfricanSudaneseSwedishSwissSyrianTaiwaneseThaiTlingit-HaidaTohono O'OdhamTonganTrinidadian and TobagonianTsimshianTurkishU.S. Virgin IslanderUgandanUkrainianUruguayanUteVenezuelanVietnameseWelshWest IndianYakamaYaquiYugoslavianYumanYup'ikZimbabwean
Immigration
NonimmigrantsImmigrantsAfghanistanAfricaAlbaniaArgentinaArmeniaAsiaAustraliaAustriaBahamasBangladeshBarbadosBelarusBelgiumBelizeBoliviaBosnia and HerzegovinaBrazilBulgariaBurma/MyanmarCambodiaCameroonCanadaCaribbeanCentral AmericaChileChinaColombiaCongoCosta RicaCroatiaCubaCzechoslovakiaDenmarkDominicaDominican RepublicEastern AfricaEastern AsiaEastern EuropeEcuadorEgyptEl SalvadorEnglandEritreaEthiopiaEuropeFijiFranceGermanyGhanaGreeceGrenadaGuatemalaGuyanaHaitiHondurasHong KongHungaryIndiaIndonesiaIranIraqIrelandIsraelItalyJamaicaJapanJordanKazakhstanKenyaKoreaKuwaitLaosLatin AmericaLatviaLebanonLiberiaLithuaniaMalaysiaMexicoMicronesiaMiddle AfricaMoldovaMoroccoNepalNetherlandsNicaraguaNigeriaNorth AmericaNorth MacedoniaNorthern AfricaNorthern EuropeNorwayOceaniaPakistanPanamaPeruPhilippinesPolandPortugalRomaniaRussiaSaudi ArabiaScotlandSenegalSerbiaSierra LeoneSingaporeSomaliaSouth AfricaSouth AmericaSouth Central AsiaSouth Eastern AsiaSouthern EuropeSpainSri LankaSt. Vincent and the GrenadinesSudanSwedenSwitzerlandSyriaTaiwanThailandTrinidad and TobagoTurkeyUgandaUkraineUruguayUzbekistanVenezuelaVietnamWest IndiesWestern AfricaWestern AsiaWestern EuropeYemenZaireZimbabweAzores
Immigrants from Cabo Verde
Race
Ancestry
AfghanAfricanAlaska NativeAlaskan AthabascanAlbanianAleutAlsatianAmericanApacheArabArapahoArgentineanArmenianAssyrian/Chaldean/SyriacAustralianAustrianBahamianBangladeshiBarbadianBasqueBelgianBelizeanBermudanBhutaneseBlackfeetBolivianBrazilianBritishBritish West IndianBulgarianBurmeseCajunCambodianCanadianCape VerdeanCarpatho RusynCelticCentral AmericanCentral American IndianCherokeeCheyenneChickasawChileanChineseChippewaChoctawColombianColvilleComancheCosta RicanCreeCreekCroatianCrowCubanCypriotCzechCzechoslovakianDanishDelawareDominicanDutchDutch West IndianEastern EuropeanEcuadorianEgyptianEnglishEstonianEthiopianEuropeanFijianFilipinoFinnishFrenchFrench American IndianFrench CanadianGermanGerman RussianGhanaianGreekGuamanian/ChamorroGuatemalanGuyaneseHaitianHmongHonduranHopiHoumaHungarianIcelanderIndian (Asian)IndonesianInupiatIranianIraqiIrishIroquoisIsraeliItalianJamaicanJapaneseJordanianKenyanKiowaKoreanLaotianLatvianLebaneseLiberianLithuanianLumbeeLuxembourgerMacedonianMalaysianMalteseMarshalleseMenomineeMexicanMexican American IndianMongolianMoroccanNative HawaiianNavajoNepaleseNew ZealanderNicaraguanNigerianNorthern EuropeanNorwegianOkinawanOsageOttawaPaiutePakistaniPalestinianPanamanianParaguayanPennsylvania GermanPeruvianPimaPolishPortuguesePotawatomiPuebloPuerto RicanPuget Sound SalishRomanianRussianSalvadoranSamoanScandinavianScotch-IrishScottishSeminoleSenegaleseSerbianShoshoneSierra LeoneanSiouxSlavicSlovakSloveneSomaliSouth AfricanSouth AmericanSouth American IndianSoviet UnionSpaniardSpanishSpanish AmericanSpanish American IndianSri LankanSubsaharan AfricanSudaneseSwedishSwissSyrianTaiwaneseThaiTlingit-HaidaTohono O'OdhamTonganTrinidadian and TobagonianTsimshianTurkishU.S. Virgin IslanderUgandanUkrainianUruguayanUteVenezuelanVietnameseWelshWest IndianYakamaYaquiYugoslavianYumanYup'ikZimbabwean
Immigration
NonimmigrantsImmigrantsAfghanistanAfricaAlbaniaArgentinaArmeniaAsiaAustraliaAustriaBahamasBangladeshBarbadosBelarusBelgiumBelizeBoliviaBosnia and HerzegovinaBrazilBulgariaBurma/MyanmarCabo VerdeCambodiaCameroonCanadaCaribbeanCentral AmericaChileChinaColombiaCongoCosta RicaCroatiaCubaCzechoslovakiaDenmarkDominicaDominican RepublicEastern AfricaEastern AsiaEastern EuropeEcuadorEgyptEl SalvadorEnglandEritreaEthiopiaEuropeFijiFranceGermanyGhanaGreeceGrenadaGuatemalaGuyanaHaitiHondurasHong KongHungaryIndiaIndonesiaIranIraqIrelandIsraelItalyJamaicaJapanJordanKazakhstanKenyaKoreaKuwaitLaosLatin AmericaLebanonLiberiaLithuaniaMalaysiaMexicoMicronesiaMiddle AfricaMoldovaMoroccoNepalNetherlandsNicaraguaNigeriaNorth AmericaNorth MacedoniaNorthern AfricaNorthern EuropeNorwayOceaniaPakistanPanamaPeruPhilippinesPolandPortugalRomaniaRussiaSaudi ArabiaScotlandSenegalSerbiaSierra LeoneSingaporeSomaliaSouth AfricaSouth AmericaSouth Central AsiaSouth Eastern AsiaSouthern EuropeSpainSri LankaSt. Vincent and the GrenadinesSudanSwedenSwitzerlandSyriaTaiwanThailandTrinidad and TobagoTurkeyUgandaUkraineUruguayUzbekistanVenezuelaVietnamWest IndiesWestern AfricaWestern AsiaWestern EuropeYemenZaireZimbabweAzores
College, 1 year or more
Income
Poverty
Unemployment
Labor Participation
Family Structure
Vehicle Availability
Education Level
Disability

College, 1 year or more Comparison

Immigrants from Latvia

Immigrants from Cabo Verde

Exceptional
Tragic
64.8%
COLLEGE, 1 YEAR OR MORE
99.9/ 100
METRIC RATING
42nd/ 347
METRIC RANK
48.1%
COLLEGE, 1 YEAR OR MORE
0.0/ 100
METRIC RATING
340th/ 347
METRIC RANK

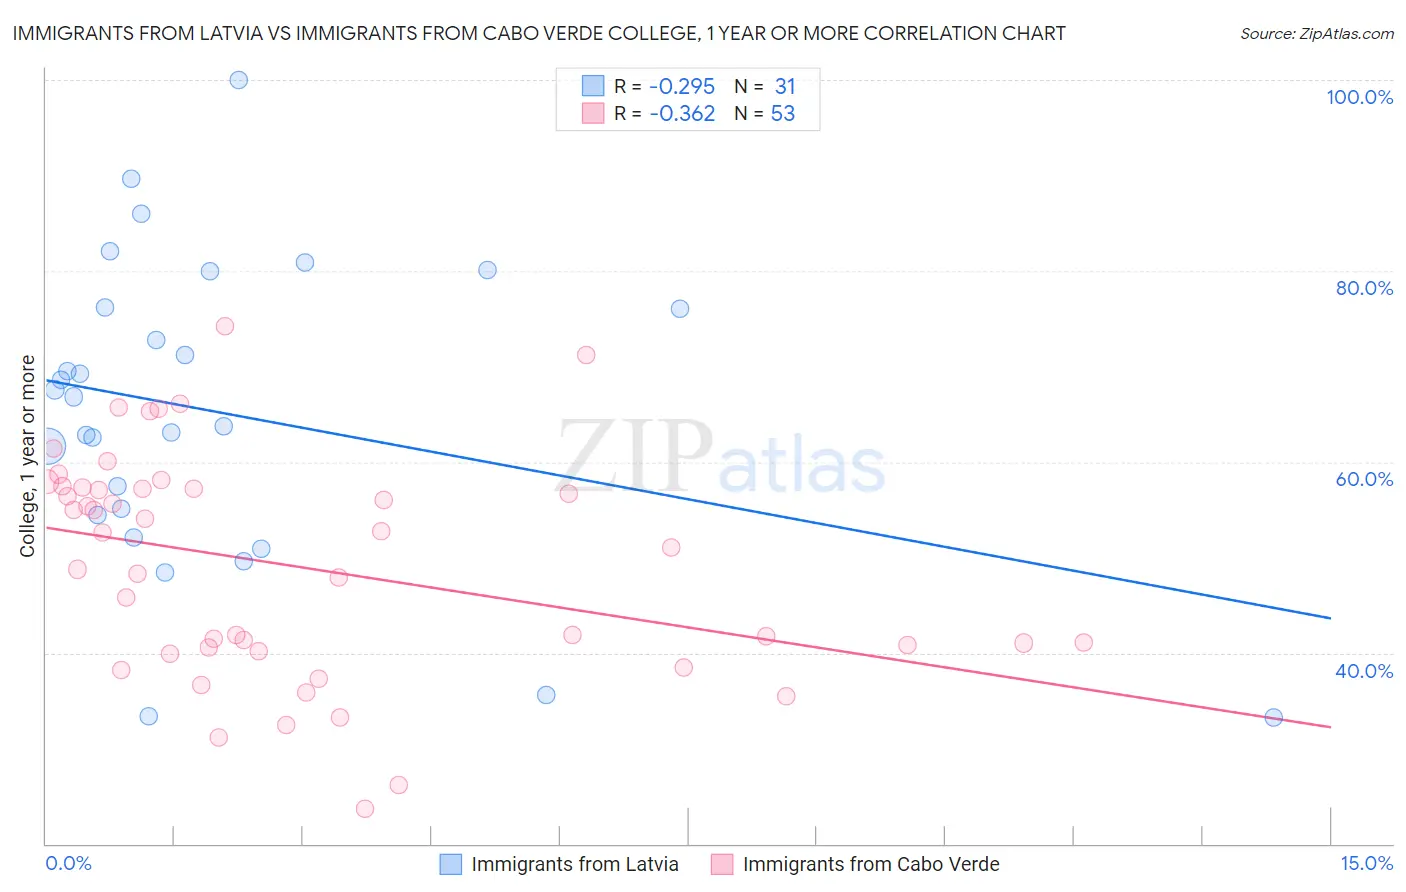
Immigrants from Latvia vs Immigrants from Cabo Verde College, 1 year or more Correlation Chart

The statistical analysis conducted on geographies consisting of 113,735,345 people shows a weak negative correlation between the proportion of Immigrants from Latvia and percentage of population with at least college, 1 year or more education in the United States with a correlation coefficient (R) of -0.295 and weighted average of 64.8%. Similarly, the statistical analysis conducted on geographies consisting of 38,158,666 people shows a mild negative correlation between the proportion of Immigrants from Cabo Verde and percentage of population with at least college, 1 year or more education in the United States with a correlation coefficient (R) of -0.362 and weighted average of 48.1%, a difference of 34.8%.
Immigrants from Latvia vs Immigrants from Cabo Verde College, 1 year or more

College, 1 year or more Correlation Summary

MeasurementImmigrants from LatviaImmigrants from Cabo Verde
Minimum33.2%23.7%
Maximum100.0%74.3%
Range66.8%50.5%
Mean65.2%49.1%
Median66.8%51.0%
Interquartile 25% (IQ1)54.4%40.4%
Interquartile 75% (IQ3)76.2%57.2%
Interquartile Range (IQR)21.8%16.8%
Standard Deviation (Sample)16.0%11.7%
Standard Deviation (Population)15.8%11.6%

Similar Demographics by College, 1 year or more

Demographics Similar to Immigrants from Latvia by College, 1 year or more

In terms of college, 1 year or more, the demographic groups most similar to Immigrants from Latvia are Mongolian (64.8%, a difference of 0.010%), Immigrants from Russia (64.7%, a difference of 0.12%), Immigrants from Norway (64.7%, a difference of 0.14%), Immigrants from Kuwait (65.0%, a difference of 0.21%), and Estonian (65.0%, a difference of 0.27%).
DemographicsRating | RankCollege, 1 year or more
Immigrants | Turkey
99.9
/100
|
#35
Exceptional
65.2%
Immigrants | South Africa
99.9
/100
|
#36
Exceptional
65.1%
Russians
99.9
/100
|
#37
Exceptional
65.1%
Immigrants | Saudi Arabia
99.9
/100
|
#38
Exceptional
65.0%
Estonians
99.9
/100
|
#39
Exceptional
65.0%
Immigrants | Kuwait
99.9
/100
|
#40
Exceptional
65.0%
Mongolians
99.9
/100
|
#41
Exceptional
64.8%
Immigrants | Latvia
99.9
/100
|
#42
Exceptional
64.8%
Immigrants | Russia
99.9
/100
|
#43
Exceptional
64.7%
Immigrants | Norway
99.9
/100
|
#44
Exceptional
64.7%
Immigrants | Lithuania
99.9
/100
|
#45
Exceptional
64.6%
Bhutanese
99.9
/100
|
#46
Exceptional
64.6%
Australians
99.9
/100
|
#47
Exceptional
64.6%
Immigrants | Bulgaria
99.9
/100
|
#48
Exceptional
64.6%
New Zealanders
99.9
/100
|
#49
Exceptional
64.6%

Demographics Similar to Immigrants from Cabo Verde by College, 1 year or more

In terms of college, 1 year or more, the demographic groups most similar to Immigrants from Cabo Verde are Immigrants from the Azores (48.4%, a difference of 0.57%), Immigrants from Central America (48.5%, a difference of 0.83%), Pennsylvania German (48.5%, a difference of 0.88%), Spanish American Indian (48.5%, a difference of 0.89%), and Immigrants from Mexico (47.5%, a difference of 1.2%).
DemographicsRating | RankCollege, 1 year or more
Immigrants | Dominican Republic
0.0
/100
|
#333
Tragic
49.1%
Lumbee
0.0
/100
|
#334
Tragic
48.9%
Yuman
0.0
/100
|
#335
Tragic
48.7%
Spanish American Indians
0.0
/100
|
#336
Tragic
48.5%
Pennsylvania Germans
0.0
/100
|
#337
Tragic
48.5%
Immigrants | Central America
0.0
/100
|
#338
Tragic
48.5%
Immigrants | Azores
0.0
/100
|
#339
Tragic
48.4%
Immigrants | Cabo Verde
0.0
/100
|
#340
Tragic
48.1%
Immigrants | Mexico
0.0
/100
|
#341
Tragic
47.5%
Inupiat
0.0
/100
|
#342
Tragic
47.2%
Tohono O'odham
0.0
/100
|
#343
Tragic
47.1%
Yakama
0.0
/100
|
#344
Tragic
46.2%
Pima
0.0
/100
|
#345
Tragic
45.6%
Houma
0.0
/100
|
#346
Tragic
41.2%
Yup'ik
0.0
/100
|
#347
Tragic
39.4%