Immigrants from Latvia vs Bhutanese 12th Grade, No Diploma
COMPARE
Immigrants from Latvia
Bhutanese
12th Grade, No Diploma
12th Grade, No Diploma Comparison
Immigrants from Latvia
Bhutanese
92.6%
12TH GRADE, NO DIPLOMA
99.5/ 100
METRIC RATING
71st/ 347
METRIC RANK
93.0%
12TH GRADE, NO DIPLOMA
99.8/ 100
METRIC RATING
41st/ 347
METRIC RANK
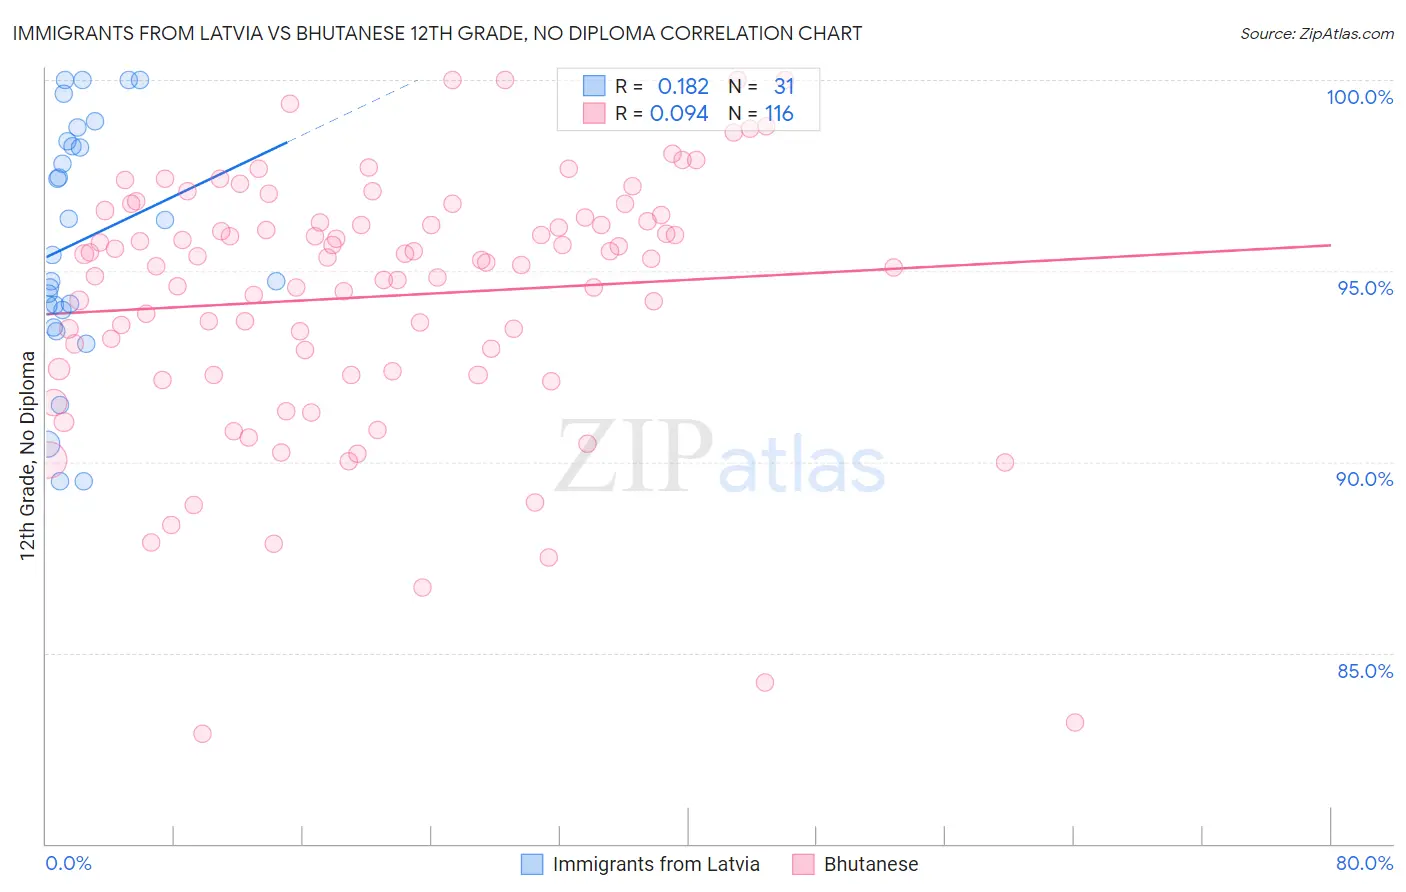
Immigrants from Latvia vs Bhutanese 12th Grade, No Diploma Correlation Chart
The statistical analysis conducted on geographies consisting of 113,735,345 people shows a poor positive correlation between the proportion of Immigrants from Latvia and percentage of population with at least 12th grade (no diploma) education in the United States with a correlation coefficient (R) of 0.182 and weighted average of 92.6%. Similarly, the statistical analysis conducted on geographies consisting of 455,591,134 people shows a slight positive correlation between the proportion of Bhutanese and percentage of population with at least 12th grade (no diploma) education in the United States with a correlation coefficient (R) of 0.094 and weighted average of 93.0%, a difference of 0.34%.
12th Grade, No Diploma Correlation Summary
| Measurement | Immigrants from Latvia | Bhutanese |
| Minimum | 89.5% | 82.9% |
| Maximum | 100.0% | 100.0% |
| Range | 10.5% | 17.1% |
| Mean | 95.8% | 94.3% |
| Median | 95.4% | 95.3% |
| Interquartile 25% (IQ1) | 94.0% | 92.4% |
| Interquartile 75% (IQ3) | 98.4% | 96.4% |
| Interquartile Range (IQR) | 4.4% | 4.0% |
| Standard Deviation (Sample) | 3.1% | 3.4% |
| Standard Deviation (Population) | 3.1% | 3.4% |
Similar Demographics by 12th Grade, No Diploma
Demographics Similar to Immigrants from Latvia by 12th Grade, No Diploma
In terms of 12th grade, no diploma, the demographic groups most similar to Immigrants from Latvia are Czechoslovakian (92.6%, a difference of 0.010%), Immigrants from South Central Asia (92.6%, a difference of 0.010%), Immigrants from South Africa (92.7%, a difference of 0.020%), Immigrants from Czechoslovakia (92.7%, a difference of 0.020%), and Immigrants from Iran (92.7%, a difference of 0.020%).
| Demographics | Rating | Rank | 12th Grade, No Diploma |
| Immigrants | Netherlands | 99.6 /100 | #64 | Exceptional 92.7% |
| Austrians | 99.6 /100 | #65 | Exceptional 92.7% |
| Soviet Union | 99.6 /100 | #66 | Exceptional 92.7% |
| Immigrants | South Africa | 99.5 /100 | #67 | Exceptional 92.7% |
| Immigrants | Czechoslovakia | 99.5 /100 | #68 | Exceptional 92.7% |
| Immigrants | Iran | 99.5 /100 | #69 | Exceptional 92.7% |
| Czechoslovakians | 99.5 /100 | #70 | Exceptional 92.6% |
| Immigrants | Latvia | 99.5 /100 | #71 | Exceptional 92.6% |
| Immigrants | South Central Asia | 99.5 /100 | #72 | Exceptional 92.6% |
| Burmese | 99.4 /100 | #73 | Exceptional 92.6% |
| Immigrants | Moldova | 99.4 /100 | #74 | Exceptional 92.6% |
| Native Hawaiians | 99.4 /100 | #75 | Exceptional 92.6% |
| French | 99.4 /100 | #76 | Exceptional 92.6% |
| Immigrants | England | 99.4 /100 | #77 | Exceptional 92.6% |
| Cambodians | 99.3 /100 | #78 | Exceptional 92.6% |
Demographics Similar to Bhutanese by 12th Grade, No Diploma
In terms of 12th grade, no diploma, the demographic groups most similar to Bhutanese are Turkish (93.0%, a difference of 0.0%), Tlingit-Haida (93.0%, a difference of 0.010%), Immigrants from Austria (93.0%, a difference of 0.010%), Immigrants from Australia (92.9%, a difference of 0.020%), and Northern European (92.9%, a difference of 0.030%).
| Demographics | Rating | Rank | 12th Grade, No Diploma |
| Okinawans | 99.9 /100 | #34 | Exceptional 93.0% |
| English | 99.9 /100 | #35 | Exceptional 93.0% |
| Scottish | 99.9 /100 | #36 | Exceptional 93.0% |
| Irish | 99.9 /100 | #37 | Exceptional 93.0% |
| Tlingit-Haida | 99.8 /100 | #38 | Exceptional 93.0% |
| Immigrants | Austria | 99.8 /100 | #39 | Exceptional 93.0% |
| Turks | 99.8 /100 | #40 | Exceptional 93.0% |
| Bhutanese | 99.8 /100 | #41 | Exceptional 93.0% |
| Immigrants | Australia | 99.8 /100 | #42 | Exceptional 92.9% |
| Northern Europeans | 99.8 /100 | #43 | Exceptional 92.9% |
| Dutch | 99.8 /100 | #44 | Exceptional 92.9% |
| Greeks | 99.8 /100 | #45 | Exceptional 92.9% |
| British | 99.8 /100 | #46 | Exceptional 92.9% |
| Belgians | 99.8 /100 | #47 | Exceptional 92.9% |
| Australians | 99.8 /100 | #48 | Exceptional 92.9% |