Immigrants from Latvia vs Apache 6th Grade
COMPARE
Immigrants from Latvia
Apache
6th Grade
6th Grade Comparison
Immigrants from Latvia
Apache
97.4%
6TH GRADE
96.7/ 100
METRIC RATING
112th/ 347
METRIC RANK
97.1%
6TH GRADE
53.6/ 100
METRIC RATING
167th/ 347
METRIC RANK
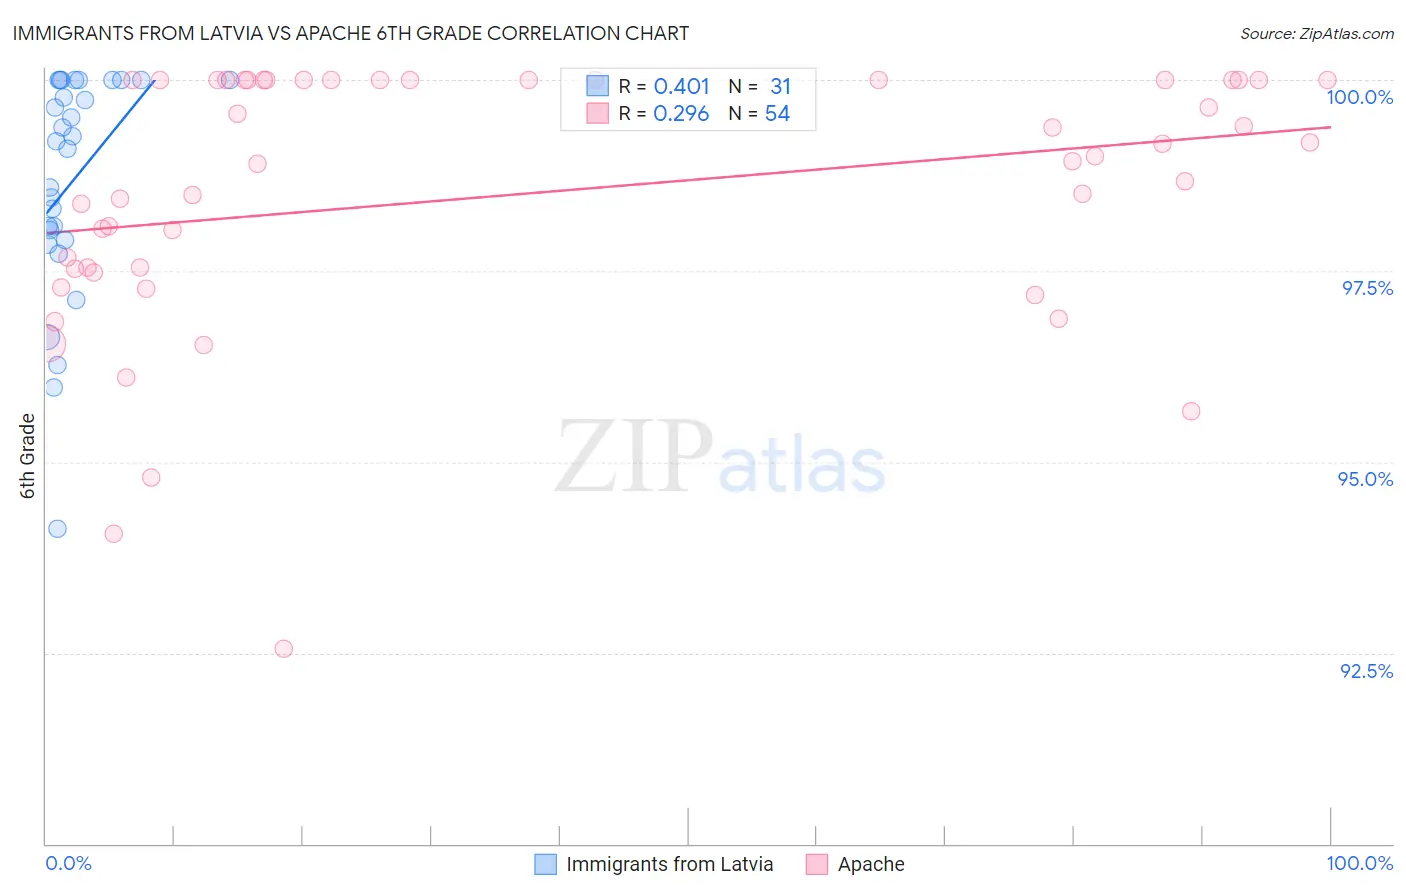
Immigrants from Latvia vs Apache 6th Grade Correlation Chart
The statistical analysis conducted on geographies consisting of 113,735,345 people shows a moderate positive correlation between the proportion of Immigrants from Latvia and percentage of population with at least 6th grade education in the United States with a correlation coefficient (R) of 0.401 and weighted average of 97.4%. Similarly, the statistical analysis conducted on geographies consisting of 231,142,814 people shows a weak positive correlation between the proportion of Apache and percentage of population with at least 6th grade education in the United States with a correlation coefficient (R) of 0.296 and weighted average of 97.1%, a difference of 0.37%.
6th Grade Correlation Summary
| Measurement | Immigrants from Latvia | Apache |
| Minimum | 94.1% | 92.5% |
| Maximum | 100.0% | 100.0% |
| Range | 5.9% | 7.5% |
| Mean | 98.7% | 98.5% |
| Median | 99.2% | 99.0% |
| Interquartile 25% (IQ1) | 97.9% | 97.5% |
| Interquartile 75% (IQ3) | 100.0% | 100.0% |
| Interquartile Range (IQR) | 2.1% | 2.5% |
| Standard Deviation (Sample) | 1.5% | 1.7% |
| Standard Deviation (Population) | 1.4% | 1.7% |
Similar Demographics by 6th Grade
Demographics Similar to Immigrants from Latvia by 6th Grade
In terms of 6th grade, the demographic groups most similar to Immigrants from Latvia are Thai (97.4%, a difference of 0.010%), Iroquois (97.4%, a difference of 0.010%), Immigrants from Saudi Arabia (97.4%, a difference of 0.010%), Colville (97.4%, a difference of 0.010%), and Nonimmigrants (97.4%, a difference of 0.020%).
| Demographics | Rating | Rank | 6th Grade |
| Cheyenne | 97.9 /100 | #105 | Exceptional 97.5% |
| Menominee | 97.7 /100 | #106 | Exceptional 97.5% |
| Immigrants | Singapore | 97.6 /100 | #107 | Exceptional 97.5% |
| Immigrants | Nonimmigrants | 97.3 /100 | #108 | Exceptional 97.4% |
| Immigrants | Czechoslovakia | 97.3 /100 | #109 | Exceptional 97.4% |
| Thais | 96.9 /100 | #110 | Exceptional 97.4% |
| Iroquois | 96.9 /100 | #111 | Exceptional 97.4% |
| Immigrants | Latvia | 96.7 /100 | #112 | Exceptional 97.4% |
| Immigrants | Saudi Arabia | 96.5 /100 | #113 | Exceptional 97.4% |
| Colville | 96.4 /100 | #114 | Exceptional 97.4% |
| Immigrants | Switzerland | 95.7 /100 | #115 | Exceptional 97.4% |
| Lebanese | 95.5 /100 | #116 | Exceptional 97.4% |
| Basques | 95.4 /100 | #117 | Exceptional 97.4% |
| Immigrants | Japan | 95.2 /100 | #118 | Exceptional 97.4% |
| Immigrants | Zimbabwe | 95.0 /100 | #119 | Exceptional 97.4% |
Demographics Similar to Apache by 6th Grade
In terms of 6th grade, the demographic groups most similar to Apache are Immigrants from Italy (97.1%, a difference of 0.0%), Immigrants from Taiwan (97.1%, a difference of 0.0%), Bermudan (97.1%, a difference of 0.0%), Immigrants from Poland (97.1%, a difference of 0.010%), and Chilean (97.1%, a difference of 0.010%).
| Demographics | Rating | Rank | 6th Grade |
| Ugandans | 62.2 /100 | #160 | Good 97.1% |
| Immigrants | Belarus | 60.4 /100 | #161 | Good 97.1% |
| Marshallese | 60.2 /100 | #162 | Good 97.1% |
| Albanians | 57.8 /100 | #163 | Average 97.1% |
| Immigrants | Korea | 57.7 /100 | #164 | Average 97.1% |
| Immigrants | Poland | 56.2 /100 | #165 | Average 97.1% |
| Immigrants | Italy | 53.8 /100 | #166 | Average 97.1% |
| Apache | 53.6 /100 | #167 | Average 97.1% |
| Immigrants | Taiwan | 53.5 /100 | #168 | Average 97.1% |
| Bermudans | 52.6 /100 | #169 | Average 97.1% |
| Chileans | 52.1 /100 | #170 | Average 97.1% |
| Immigrants | Sri Lanka | 51.7 /100 | #171 | Average 97.1% |
| Egyptians | 50.9 /100 | #172 | Average 97.1% |
| Arabs | 50.1 /100 | #173 | Average 97.0% |
| Venezuelans | 50.0 /100 | #174 | Average 97.0% |