Immigrants from Latin America vs Armenian College, Under 1 year
COMPARE
Immigrants from Latin America
Armenian
College, Under 1 year
College, Under 1 year Comparison
Immigrants from Latin America
Armenians
56.3%
COLLEGE, UNDER 1 YEAR
0.0/ 100
METRIC RATING
325th/ 347
METRIC RANK
68.1%
COLLEGE, UNDER 1 YEAR
97.7/ 100
METRIC RATING
94th/ 347
METRIC RANK
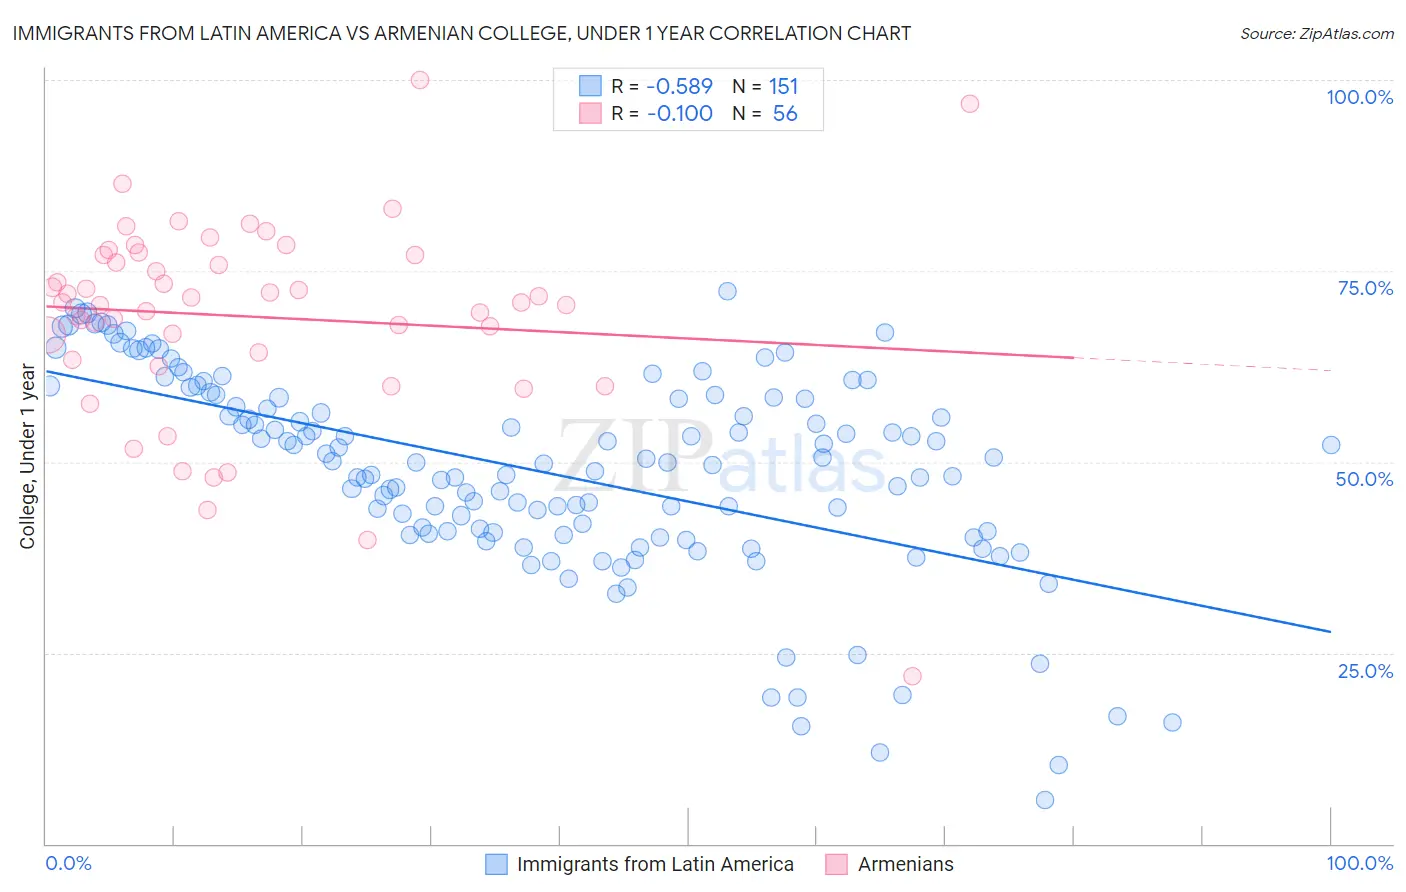
Immigrants from Latin America vs Armenian College, Under 1 year Correlation Chart
The statistical analysis conducted on geographies consisting of 558,640,127 people shows a substantial negative correlation between the proportion of Immigrants from Latin America and percentage of population with at least college, under 1 year education in the United States with a correlation coefficient (R) of -0.589 and weighted average of 56.3%. Similarly, the statistical analysis conducted on geographies consisting of 310,952,332 people shows a poor negative correlation between the proportion of Armenians and percentage of population with at least college, under 1 year education in the United States with a correlation coefficient (R) of -0.100 and weighted average of 68.1%, a difference of 20.9%.
College, Under 1 year Correlation Summary
| Measurement | Immigrants from Latin America | Armenian |
| Minimum | 5.7% | 22.0% |
| Maximum | 72.4% | 100.0% |
| Range | 66.6% | 78.0% |
| Mean | 48.7% | 69.0% |
| Median | 50.0% | 70.8% |
| Interquartile 25% (IQ1) | 40.7% | 63.9% |
| Interquartile 75% (IQ3) | 58.5% | 77.1% |
| Interquartile Range (IQR) | 17.7% | 13.2% |
| Standard Deviation (Sample) | 13.4% | 13.2% |
| Standard Deviation (Population) | 13.3% | 13.1% |
Similar Demographics by College, Under 1 year
Demographics Similar to Immigrants from Latin America by College, Under 1 year
In terms of college, under 1 year, the demographic groups most similar to Immigrants from Latin America are Immigrants from El Salvador (56.4%, a difference of 0.10%), Navajo (56.3%, a difference of 0.15%), Immigrants from Honduras (56.5%, a difference of 0.23%), Immigrants from Guatemala (56.2%, a difference of 0.24%), and Immigrants from Caribbean (56.6%, a difference of 0.41%).
| Demographics | Rating | Rank | College, Under 1 year |
| Immigrants | Haiti | 0.0 /100 | #318 | Tragic 56.9% |
| Puerto Ricans | 0.0 /100 | #319 | Tragic 56.8% |
| Guatemalans | 0.0 /100 | #320 | Tragic 56.8% |
| Natives/Alaskans | 0.0 /100 | #321 | Tragic 56.6% |
| Immigrants | Caribbean | 0.0 /100 | #322 | Tragic 56.6% |
| Immigrants | Honduras | 0.0 /100 | #323 | Tragic 56.5% |
| Immigrants | El Salvador | 0.0 /100 | #324 | Tragic 56.4% |
| Immigrants | Latin America | 0.0 /100 | #325 | Tragic 56.3% |
| Navajo | 0.0 /100 | #326 | Tragic 56.3% |
| Immigrants | Guatemala | 0.0 /100 | #327 | Tragic 56.2% |
| Cape Verdeans | 0.0 /100 | #328 | Tragic 56.0% |
| Immigrants | Cuba | 0.0 /100 | #329 | Tragic 55.7% |
| Mexicans | 0.0 /100 | #330 | Tragic 55.6% |
| Dominicans | 0.0 /100 | #331 | Tragic 55.5% |
| Immigrants | Yemen | 0.0 /100 | #332 | Tragic 55.3% |
Demographics Similar to Armenians by College, Under 1 year
In terms of college, under 1 year, the demographic groups most similar to Armenians are Romanian (68.2%, a difference of 0.090%), Immigrants from Pakistan (68.0%, a difference of 0.090%), Jordanian (68.0%, a difference of 0.13%), Immigrants from Ethiopia (68.0%, a difference of 0.15%), and Luxembourger (68.2%, a difference of 0.19%).
| Demographics | Rating | Rank | College, Under 1 year |
| Chinese | 98.3 /100 | #87 | Exceptional 68.3% |
| Croatians | 98.2 /100 | #88 | Exceptional 68.3% |
| Ethiopians | 98.2 /100 | #89 | Exceptional 68.3% |
| Icelanders | 98.1 /100 | #90 | Exceptional 68.3% |
| Europeans | 98.1 /100 | #91 | Exceptional 68.2% |
| Luxembourgers | 98.1 /100 | #92 | Exceptional 68.2% |
| Romanians | 97.9 /100 | #93 | Exceptional 68.2% |
| Armenians | 97.7 /100 | #94 | Exceptional 68.1% |
| Immigrants | Pakistan | 97.5 /100 | #95 | Exceptional 68.0% |
| Jordanians | 97.4 /100 | #96 | Exceptional 68.0% |
| Immigrants | Ethiopia | 97.3 /100 | #97 | Exceptional 68.0% |
| Paraguayans | 97.1 /100 | #98 | Exceptional 67.9% |
| Immigrants | Bolivia | 97.0 /100 | #99 | Exceptional 67.9% |
| Immigrants | Argentina | 97.0 /100 | #100 | Exceptional 67.9% |
| Immigrants | Eastern Europe | 96.9 /100 | #101 | Exceptional 67.9% |