Immigrants from Laos vs Immigrants from Moldova 5th Grade
COMPARE
Immigrants from Laos
Immigrants from Moldova
5th Grade
5th Grade Comparison
Immigrants from Laos
Immigrants from Moldova
96.0%
5TH GRADE
0.0/ 100
METRIC RATING
305th/ 347
METRIC RANK
97.5%
5TH GRADE
87.5/ 100
METRIC RATING
136th/ 347
METRIC RANK
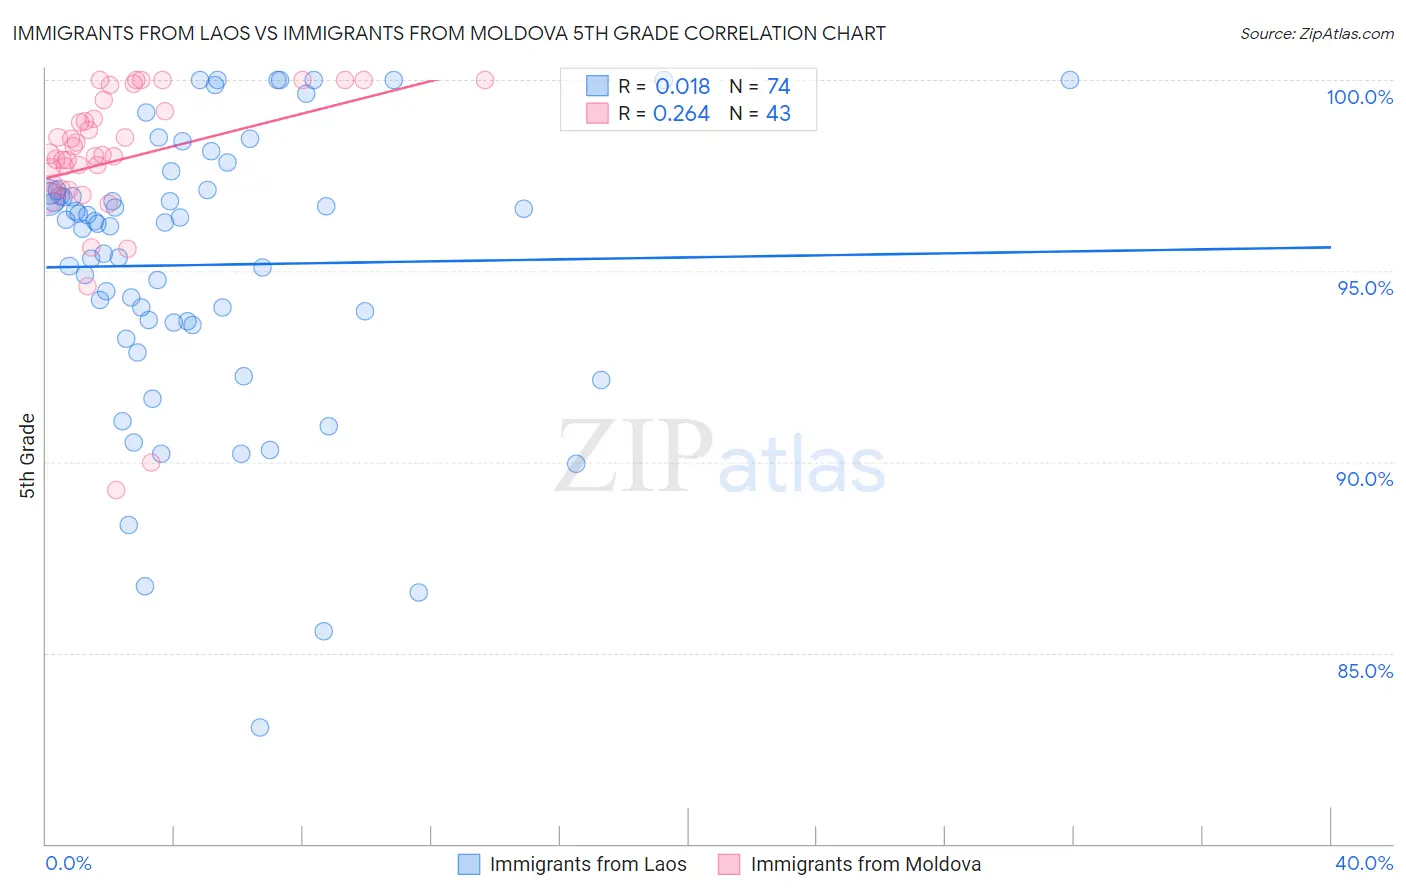
Immigrants from Laos vs Immigrants from Moldova 5th Grade Correlation Chart
The statistical analysis conducted on geographies consisting of 201,472,886 people shows no correlation between the proportion of Immigrants from Laos and percentage of population with at least 5th grade education in the United States with a correlation coefficient (R) of 0.018 and weighted average of 96.0%. Similarly, the statistical analysis conducted on geographies consisting of 124,398,501 people shows a weak positive correlation between the proportion of Immigrants from Moldova and percentage of population with at least 5th grade education in the United States with a correlation coefficient (R) of 0.264 and weighted average of 97.5%, a difference of 1.5%.
5th Grade Correlation Summary
| Measurement | Immigrants from Laos | Immigrants from Moldova |
| Minimum | 83.0% | 89.3% |
| Maximum | 100.0% | 100.0% |
| Range | 17.0% | 10.7% |
| Mean | 95.2% | 97.9% |
| Median | 96.3% | 98.1% |
| Interquartile 25% (IQ1) | 93.7% | 97.3% |
| Interquartile 75% (IQ3) | 97.1% | 99.5% |
| Interquartile Range (IQR) | 3.4% | 2.2% |
| Standard Deviation (Sample) | 3.7% | 2.3% |
| Standard Deviation (Population) | 3.7% | 2.2% |
Similar Demographics by 5th Grade
Demographics Similar to Immigrants from Laos by 5th Grade
In terms of 5th grade, the demographic groups most similar to Immigrants from Laos are Immigrants from Burma/Myanmar (96.1%, a difference of 0.010%), Immigrants from Haiti (96.0%, a difference of 0.010%), Immigrants from Caribbean (96.0%, a difference of 0.020%), Ecuadorian (96.0%, a difference of 0.030%), and Immigrants from Guyana (96.0%, a difference of 0.030%).
| Demographics | Rating | Rank | 5th Grade |
| Immigrants | Dominica | 0.0 /100 | #298 | Tragic 96.2% |
| Immigrants | Immigrants | 0.0 /100 | #299 | Tragic 96.2% |
| Sri Lankans | 0.0 /100 | #300 | Tragic 96.1% |
| Immigrants | Cuba | 0.0 /100 | #301 | Tragic 96.1% |
| Guyanese | 0.0 /100 | #302 | Tragic 96.1% |
| Puerto Ricans | 0.0 /100 | #303 | Tragic 96.1% |
| Immigrants | Burma/Myanmar | 0.0 /100 | #304 | Tragic 96.1% |
| Immigrants | Laos | 0.0 /100 | #305 | Tragic 96.0% |
| Immigrants | Haiti | 0.0 /100 | #306 | Tragic 96.0% |
| Immigrants | Caribbean | 0.0 /100 | #307 | Tragic 96.0% |
| Ecuadorians | 0.0 /100 | #308 | Tragic 96.0% |
| Immigrants | Guyana | 0.0 /100 | #309 | Tragic 96.0% |
| Indonesians | 0.0 /100 | #310 | Tragic 96.0% |
| Immigrants | Bangladesh | 0.0 /100 | #311 | Tragic 96.0% |
| Vietnamese | 0.0 /100 | #312 | Tragic 95.9% |
Demographics Similar to Immigrants from Moldova by 5th Grade
In terms of 5th grade, the demographic groups most similar to Immigrants from Moldova are Filipino (97.5%, a difference of 0.010%), Blackfeet (97.5%, a difference of 0.010%), Immigrants from Turkey (97.5%, a difference of 0.010%), Burmese (97.5%, a difference of 0.010%), and Palestinian (97.5%, a difference of 0.020%).
| Demographics | Rating | Rank | 5th Grade |
| Immigrants | Europe | 91.9 /100 | #129 | Exceptional 97.6% |
| Immigrants | Romania | 91.6 /100 | #130 | Exceptional 97.6% |
| Pima | 91.2 /100 | #131 | Exceptional 97.6% |
| Immigrants | Kuwait | 90.4 /100 | #132 | Exceptional 97.6% |
| Cambodians | 90.2 /100 | #133 | Exceptional 97.6% |
| Immigrants | Hungary | 90.1 /100 | #134 | Exceptional 97.6% |
| Palestinians | 89.3 /100 | #135 | Excellent 97.5% |
| Immigrants | Moldova | 87.5 /100 | #136 | Excellent 97.5% |
| Filipinos | 86.8 /100 | #137 | Excellent 97.5% |
| Blackfeet | 86.8 /100 | #138 | Excellent 97.5% |
| Immigrants | Turkey | 86.7 /100 | #139 | Excellent 97.5% |
| Burmese | 86.1 /100 | #140 | Excellent 97.5% |
| Seminole | 85.8 /100 | #141 | Excellent 97.5% |
| Israelis | 85.5 /100 | #142 | Excellent 97.5% |
| Immigrants | North Macedonia | 85.4 /100 | #143 | Excellent 97.5% |