Immigrants from Laos vs Immigrants from Fiji 8th Grade
COMPARE
Immigrants from Laos
Immigrants from Fiji
8th Grade
8th Grade Comparison
Immigrants from Laos
Immigrants from Fiji
94.1%
8TH GRADE
0.0/ 100
METRIC RATING
301st/ 347
METRIC RANK
93.2%
8TH GRADE
0.0/ 100
METRIC RATING
320th/ 347
METRIC RANK
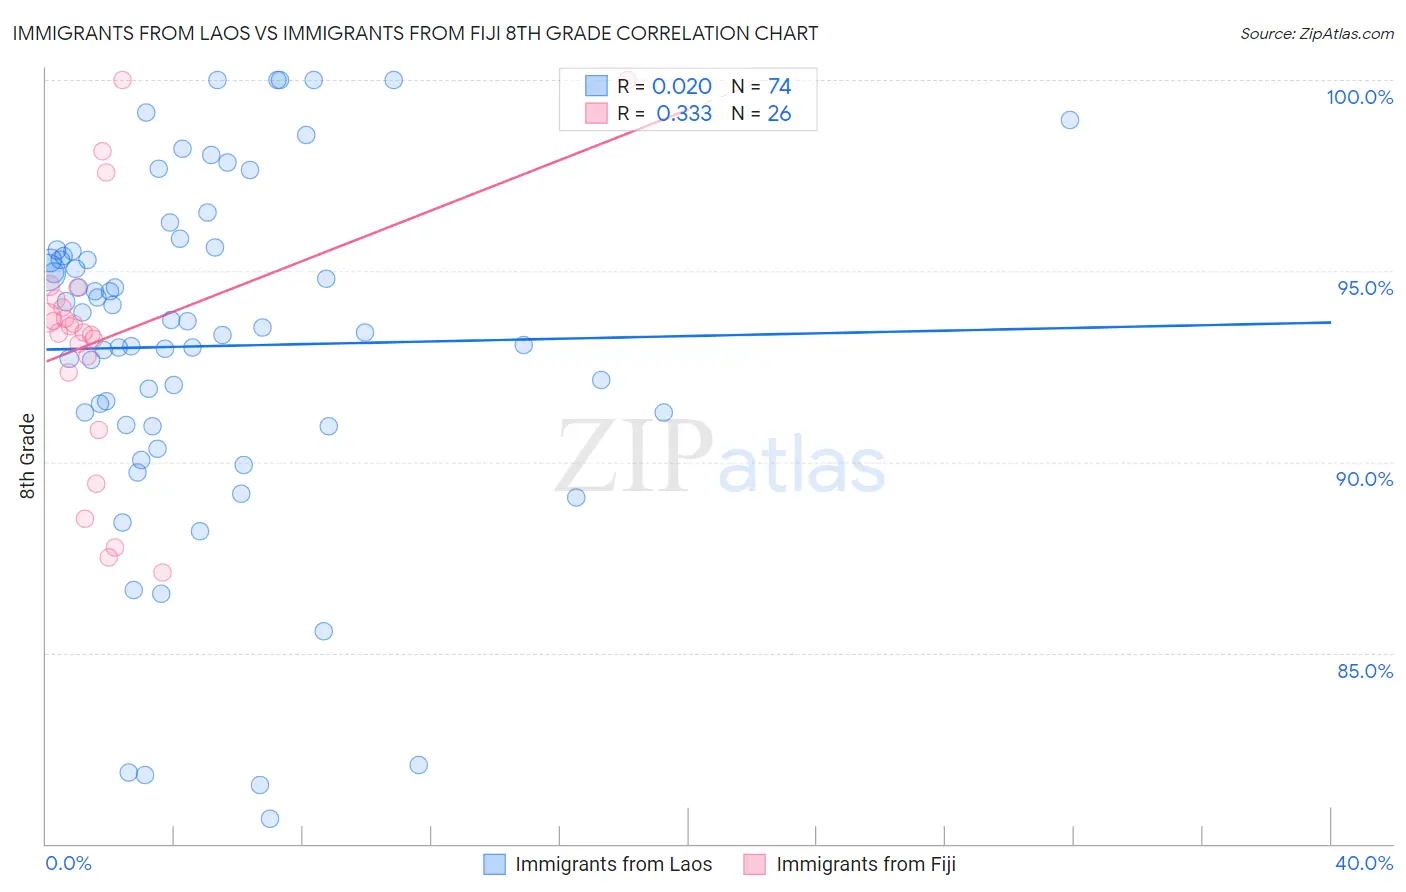
Immigrants from Laos vs Immigrants from Fiji 8th Grade Correlation Chart
The statistical analysis conducted on geographies consisting of 201,472,886 people shows no correlation between the proportion of Immigrants from Laos and percentage of population with at least 8th grade education in the United States with a correlation coefficient (R) of 0.020 and weighted average of 94.1%. Similarly, the statistical analysis conducted on geographies consisting of 93,756,204 people shows a mild positive correlation between the proportion of Immigrants from Fiji and percentage of population with at least 8th grade education in the United States with a correlation coefficient (R) of 0.333 and weighted average of 93.2%, a difference of 0.98%.
8th Grade Correlation Summary
| Measurement | Immigrants from Laos | Immigrants from Fiji |
| Minimum | 80.6% | 87.1% |
| Maximum | 100.0% | 100.0% |
| Range | 19.4% | 12.9% |
| Mean | 93.0% | 93.2% |
| Median | 93.6% | 93.5% |
| Interquartile 25% (IQ1) | 91.0% | 92.4% |
| Interquartile 75% (IQ3) | 95.5% | 94.3% |
| Interquartile Range (IQR) | 4.6% | 1.9% |
| Standard Deviation (Sample) | 4.5% | 3.4% |
| Standard Deviation (Population) | 4.5% | 3.3% |
Demographics Similar to Immigrants from Laos and Immigrants from Fiji by 8th Grade
In terms of 8th grade, the demographic groups most similar to Immigrants from Laos are Immigrants from Burma/Myanmar (94.1%, a difference of 0.020%), Sri Lankan (94.0%, a difference of 0.10%), Immigrants from Dominica (94.0%, a difference of 0.14%), Guyanese (93.9%, a difference of 0.23%), and Immigrants from Haiti (93.9%, a difference of 0.26%). Similarly, the demographic groups most similar to Immigrants from Fiji are Immigrants from Cuba (93.2%, a difference of 0.030%), Puerto Rican (93.2%, a difference of 0.060%), Immigrants from Ecuador (93.3%, a difference of 0.070%), Immigrants from Cambodia (93.3%, a difference of 0.12%), and Immigrants from Vietnam (93.5%, a difference of 0.32%).
| Demographics | Rating | Rank | 8th Grade |
| Immigrants | Burma/Myanmar | 0.0 /100 | #300 | Tragic 94.1% |
| Immigrants | Laos | 0.0 /100 | #301 | Tragic 94.1% |
| Sri Lankans | 0.0 /100 | #302 | Tragic 94.0% |
| Immigrants | Dominica | 0.0 /100 | #303 | Tragic 94.0% |
| Guyanese | 0.0 /100 | #304 | Tragic 93.9% |
| Immigrants | Haiti | 0.0 /100 | #305 | Tragic 93.9% |
| Immigrants | Guyana | 0.0 /100 | #306 | Tragic 93.8% |
| Immigrants | Portugal | 0.0 /100 | #307 | Tragic 93.8% |
| Ecuadorians | 0.0 /100 | #308 | Tragic 93.6% |
| Immigrants | Immigrants | 0.0 /100 | #309 | Tragic 93.6% |
| Japanese | 0.0 /100 | #310 | Tragic 93.6% |
| Immigrants | Bangladesh | 0.0 /100 | #311 | Tragic 93.6% |
| Cape Verdeans | 0.0 /100 | #312 | Tragic 93.5% |
| Immigrants | Caribbean | 0.0 /100 | #313 | Tragic 93.5% |
| Immigrants | Vietnam | 0.0 /100 | #314 | Tragic 93.5% |
| Vietnamese | 0.0 /100 | #315 | Tragic 93.5% |
| Immigrants | Cambodia | 0.0 /100 | #316 | Tragic 93.3% |
| Immigrants | Ecuador | 0.0 /100 | #317 | Tragic 93.3% |
| Puerto Ricans | 0.0 /100 | #318 | Tragic 93.2% |
| Immigrants | Cuba | 0.0 /100 | #319 | Tragic 93.2% |
| Immigrants | Fiji | 0.0 /100 | #320 | Tragic 93.2% |