Immigrants from Kuwait vs Navajo Bachelor's Degree
COMPARE
Immigrants from Kuwait
Navajo
Bachelor's Degree
Bachelor's Degree Comparison
Immigrants from Kuwait
Navajo
44.6%
BACHELOR'S DEGREE
99.9/ 100
METRIC RATING
45th/ 347
METRIC RANK
23.6%
BACHELOR'S DEGREE
0.0/ 100
METRIC RATING
344th/ 347
METRIC RANK
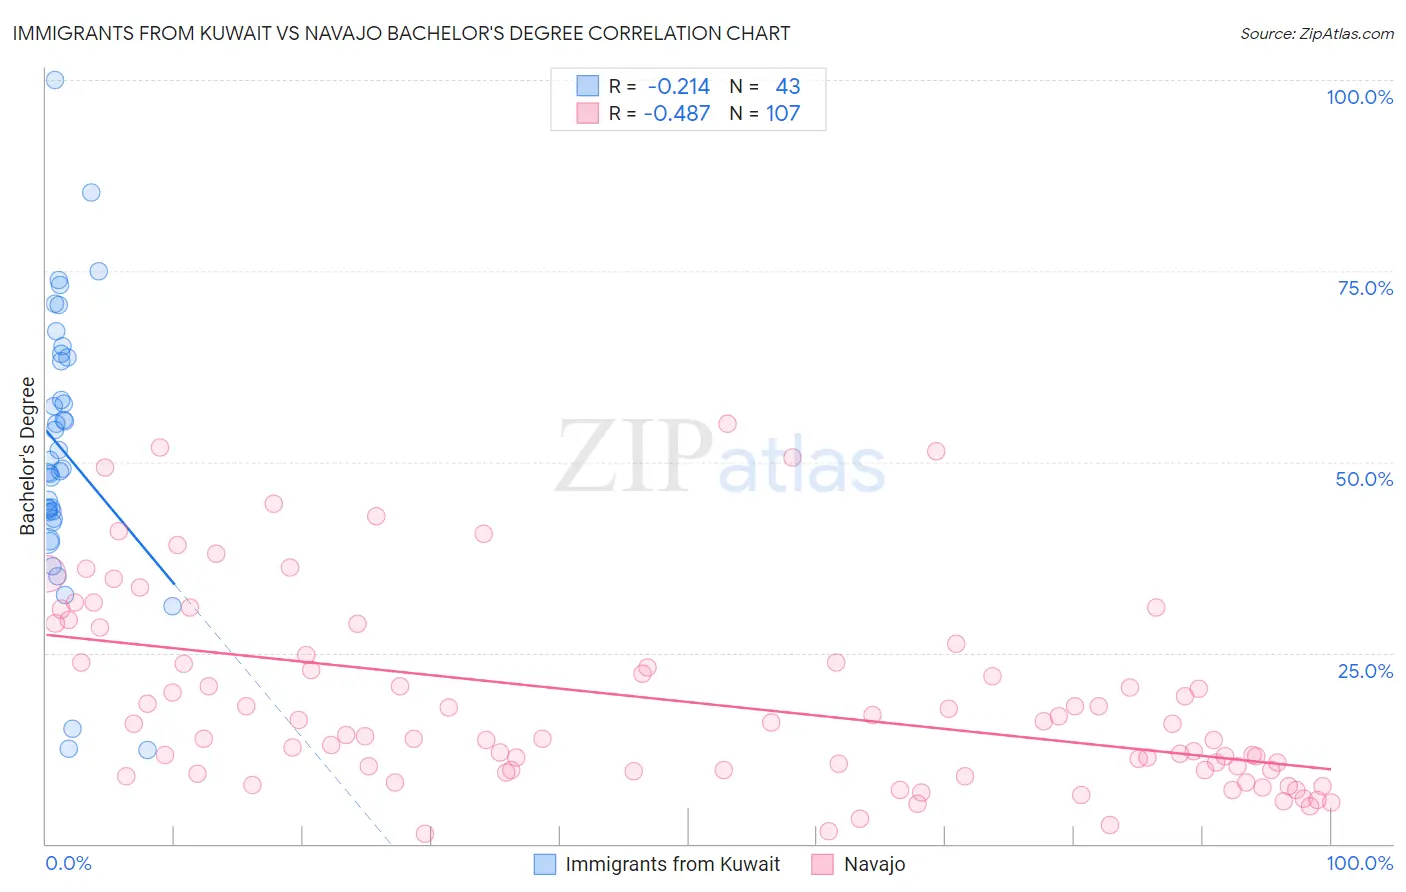
Immigrants from Kuwait vs Navajo Bachelor's Degree Correlation Chart
The statistical analysis conducted on geographies consisting of 136,917,085 people shows a weak negative correlation between the proportion of Immigrants from Kuwait and percentage of population with at least bachelor's degree education in the United States with a correlation coefficient (R) of -0.214 and weighted average of 44.6%. Similarly, the statistical analysis conducted on geographies consisting of 224,864,569 people shows a moderate negative correlation between the proportion of Navajo and percentage of population with at least bachelor's degree education in the United States with a correlation coefficient (R) of -0.487 and weighted average of 23.6%, a difference of 88.9%.
Bachelor's Degree Correlation Summary
| Measurement | Immigrants from Kuwait | Navajo |
| Minimum | 12.3% | 1.3% |
| Maximum | 100.0% | 54.9% |
| Range | 87.7% | 53.6% |
| Mean | 51.4% | 18.7% |
| Median | 49.2% | 14.3% |
| Interquartile 25% (IQ1) | 42.5% | 9.6% |
| Interquartile 75% (IQ3) | 63.7% | 24.7% |
| Interquartile Range (IQR) | 21.2% | 15.1% |
| Standard Deviation (Sample) | 17.8% | 12.6% |
| Standard Deviation (Population) | 17.6% | 12.5% |
Similar Demographics by Bachelor's Degree
Demographics Similar to Immigrants from Kuwait by Bachelor's Degree
In terms of bachelor's degree, the demographic groups most similar to Immigrants from Kuwait are Immigrants from Lithuania (44.6%, a difference of 0.030%), Immigrants from Bulgaria (44.6%, a difference of 0.060%), Bolivian (44.6%, a difference of 0.090%), Estonian (44.6%, a difference of 0.10%), and Immigrants from Norway (44.5%, a difference of 0.22%).
| Demographics | Rating | Rank | Bachelor's Degree |
| Bulgarians | 100.0 /100 | #38 | Exceptional 45.3% |
| Immigrants | Latvia | 100.0 /100 | #39 | Exceptional 45.1% |
| Immigrants | Belarus | 100.0 /100 | #40 | Exceptional 45.0% |
| Immigrants | Malaysia | 100.0 /100 | #41 | Exceptional 45.0% |
| Immigrants | Saudi Arabia | 100.0 /100 | #42 | Exceptional 44.8% |
| Immigrants | South Africa | 99.9 /100 | #43 | Exceptional 44.8% |
| Immigrants | Lithuania | 99.9 /100 | #44 | Exceptional 44.6% |
| Immigrants | Kuwait | 99.9 /100 | #45 | Exceptional 44.6% |
| Immigrants | Bulgaria | 99.9 /100 | #46 | Exceptional 44.6% |
| Bolivians | 99.9 /100 | #47 | Exceptional 44.6% |
| Estonians | 99.9 /100 | #48 | Exceptional 44.6% |
| Immigrants | Norway | 99.9 /100 | #49 | Exceptional 44.5% |
| Immigrants | Greece | 99.9 /100 | #50 | Exceptional 44.5% |
| Asians | 99.9 /100 | #51 | Exceptional 44.4% |
| Immigrants | Spain | 99.9 /100 | #52 | Exceptional 44.3% |
Demographics Similar to Navajo by Bachelor's Degree
In terms of bachelor's degree, the demographic groups most similar to Navajo are Pima (23.2%, a difference of 1.8%), Tohono O'odham (24.4%, a difference of 3.4%), Yakama (24.5%, a difference of 3.6%), Yuman (24.5%, a difference of 3.9%), and Lumbee (24.8%, a difference of 4.8%).
| Demographics | Rating | Rank | Bachelor's Degree |
| Mexicans | 0.0 /100 | #333 | Tragic 27.1% |
| Arapaho | 0.0 /100 | #334 | Tragic 26.6% |
| Natives/Alaskans | 0.0 /100 | #335 | Tragic 26.3% |
| Immigrants | Mexico | 0.0 /100 | #336 | Tragic 26.1% |
| Inupiat | 0.0 /100 | #337 | Tragic 25.8% |
| Pueblo | 0.0 /100 | #338 | Tragic 25.5% |
| Hopi | 0.0 /100 | #339 | Tragic 25.3% |
| Lumbee | 0.0 /100 | #340 | Tragic 24.8% |
| Yuman | 0.0 /100 | #341 | Tragic 24.5% |
| Yakama | 0.0 /100 | #342 | Tragic 24.5% |
| Tohono O'odham | 0.0 /100 | #343 | Tragic 24.4% |
| Navajo | 0.0 /100 | #344 | Tragic 23.6% |
| Pima | 0.0 /100 | #345 | Tragic 23.2% |
| Houma | 0.0 /100 | #346 | Tragic 21.4% |
| Yup'ik | 0.0 /100 | #347 | Tragic 19.4% |