Immigrants from Kuwait vs Inupiat 6th Grade
COMPARE
Immigrants from Kuwait
Inupiat
6th Grade
6th Grade Comparison
Immigrants from Kuwait
Inupiat
97.3%
6TH GRADE
89.5/ 100
METRIC RATING
134th/ 347
METRIC RANK
98.1%
6TH GRADE
100.0/ 100
METRIC RATING
15th/ 347
METRIC RANK
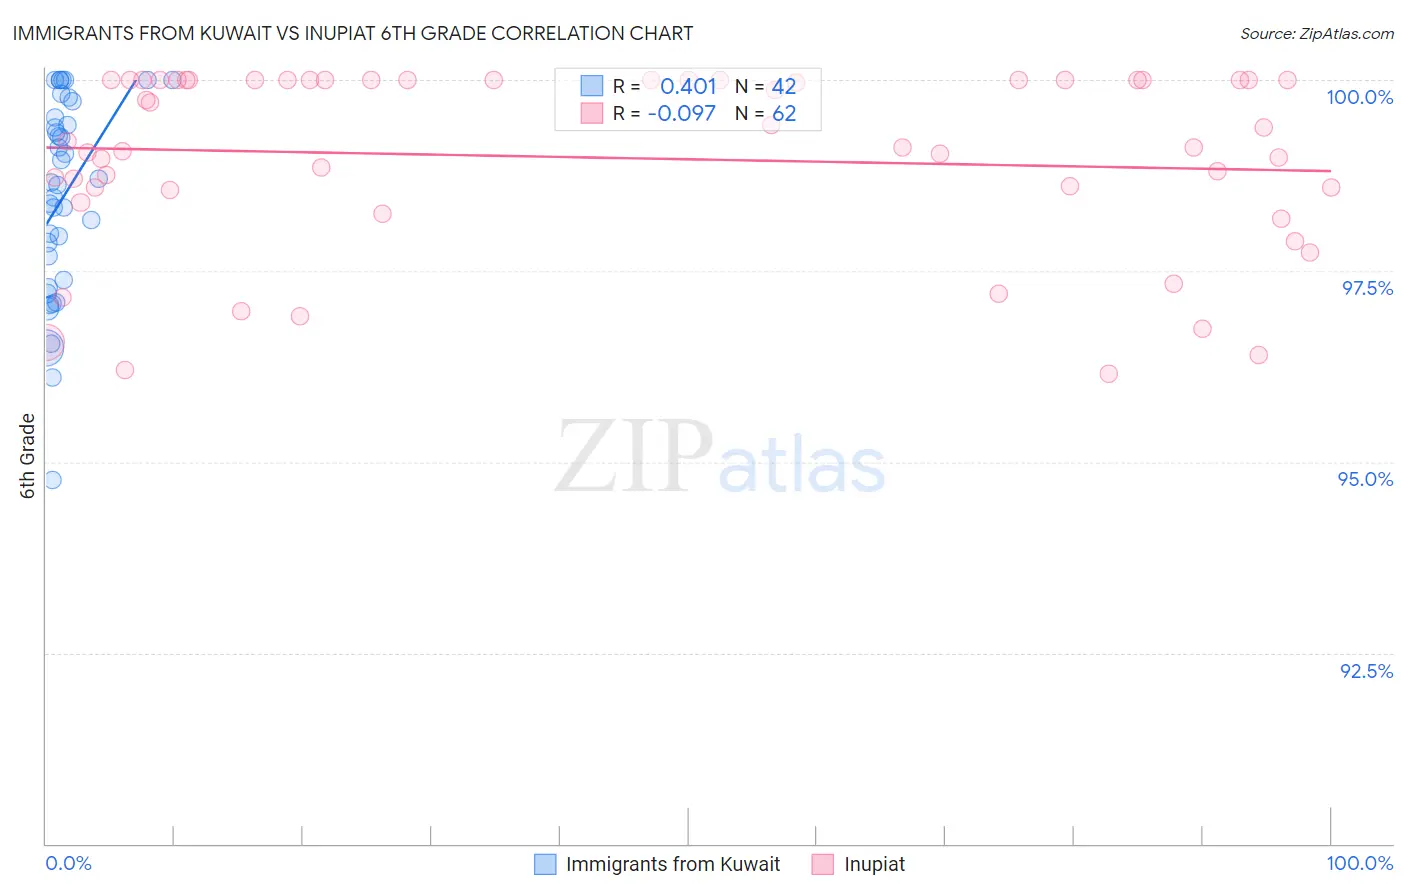
Immigrants from Kuwait vs Inupiat 6th Grade Correlation Chart
The statistical analysis conducted on geographies consisting of 136,913,666 people shows a moderate positive correlation between the proportion of Immigrants from Kuwait and percentage of population with at least 6th grade education in the United States with a correlation coefficient (R) of 0.401 and weighted average of 97.3%. Similarly, the statistical analysis conducted on geographies consisting of 96,348,974 people shows a slight negative correlation between the proportion of Inupiat and percentage of population with at least 6th grade education in the United States with a correlation coefficient (R) of -0.097 and weighted average of 98.1%, a difference of 0.85%.
6th Grade Correlation Summary
| Measurement | Immigrants from Kuwait | Inupiat |
| Minimum | 94.8% | 96.2% |
| Maximum | 100.0% | 100.0% |
| Range | 5.2% | 3.8% |
| Mean | 98.5% | 99.0% |
| Median | 98.6% | 99.2% |
| Interquartile 25% (IQ1) | 97.4% | 98.6% |
| Interquartile 75% (IQ3) | 99.5% | 100.0% |
| Interquartile Range (IQR) | 2.1% | 1.4% |
| Standard Deviation (Sample) | 1.3% | 1.2% |
| Standard Deviation (Population) | 1.3% | 1.2% |
Similar Demographics by 6th Grade
Demographics Similar to Immigrants from Kuwait by 6th Grade
In terms of 6th grade, the demographic groups most similar to Immigrants from Kuwait are Immigrants from Hungary (97.3%, a difference of 0.0%), Immigrants from Moldova (97.3%, a difference of 0.010%), Filipino (97.3%, a difference of 0.010%), Immigrants from Europe (97.3%, a difference of 0.020%), and Palestinian (97.3%, a difference of 0.020%).
| Demographics | Rating | Rank | 6th Grade |
| Immigrants | Croatia | 93.1 /100 | #127 | Exceptional 97.3% |
| Immigrants | Romania | 92.0 /100 | #128 | Exceptional 97.3% |
| Immigrants | Serbia | 91.9 /100 | #129 | Exceptional 97.3% |
| Cambodians | 91.8 /100 | #130 | Exceptional 97.3% |
| Immigrants | Europe | 91.1 /100 | #131 | Exceptional 97.3% |
| Palestinians | 90.9 /100 | #132 | Exceptional 97.3% |
| Immigrants | Moldova | 90.0 /100 | #133 | Excellent 97.3% |
| Immigrants | Kuwait | 89.5 /100 | #134 | Excellent 97.3% |
| Immigrants | Hungary | 89.5 /100 | #135 | Excellent 97.3% |
| Filipinos | 88.9 /100 | #136 | Excellent 97.3% |
| Burmese | 87.8 /100 | #137 | Excellent 97.3% |
| Blackfeet | 87.7 /100 | #138 | Excellent 97.3% |
| Immigrants | Turkey | 86.1 /100 | #139 | Excellent 97.3% |
| Immigrants | North Macedonia | 85.5 /100 | #140 | Excellent 97.2% |
| Seminole | 84.8 /100 | #141 | Excellent 97.2% |
Demographics Similar to Inupiat by 6th Grade
In terms of 6th grade, the demographic groups most similar to Inupiat are Carpatho Rusyn (98.1%, a difference of 0.010%), Scottish (98.1%, a difference of 0.010%), Tlingit-Haida (98.1%, a difference of 0.020%), Polish (98.1%, a difference of 0.020%), and Pennsylvania German (98.1%, a difference of 0.020%).
| Demographics | Rating | Rank | 6th Grade |
| Slovaks | 100.0 /100 | #8 | Exceptional 98.2% |
| Slovenes | 100.0 /100 | #9 | Exceptional 98.2% |
| Swedes | 100.0 /100 | #10 | Exceptional 98.2% |
| English | 100.0 /100 | #11 | Exceptional 98.1% |
| Alaskan Athabascans | 100.0 /100 | #12 | Exceptional 98.1% |
| Tlingit-Haida | 100.0 /100 | #13 | Exceptional 98.1% |
| Carpatho Rusyns | 100.0 /100 | #14 | Exceptional 98.1% |
| Inupiat | 100.0 /100 | #15 | Exceptional 98.1% |
| Scottish | 100.0 /100 | #16 | Exceptional 98.1% |
| Poles | 100.0 /100 | #17 | Exceptional 98.1% |
| Pennsylvania Germans | 100.0 /100 | #18 | Exceptional 98.1% |
| Irish | 100.0 /100 | #19 | Exceptional 98.1% |
| Finns | 100.0 /100 | #20 | Exceptional 98.1% |
| Lithuanians | 100.0 /100 | #21 | Exceptional 98.1% |
| Danes | 100.0 /100 | #22 | Exceptional 98.0% |