Immigrants from Kuwait vs Immigrants from Eastern Europe 10th Grade
COMPARE
Immigrants from Kuwait
Immigrants from Eastern Europe
10th Grade
10th Grade Comparison
Immigrants from Kuwait
Immigrants from Eastern Europe
94.4%
10TH GRADE
96.8/ 100
METRIC RATING
112th/ 347
METRIC RANK
94.3%
10TH GRADE
92.5/ 100
METRIC RATING
131st/ 347
METRIC RANK
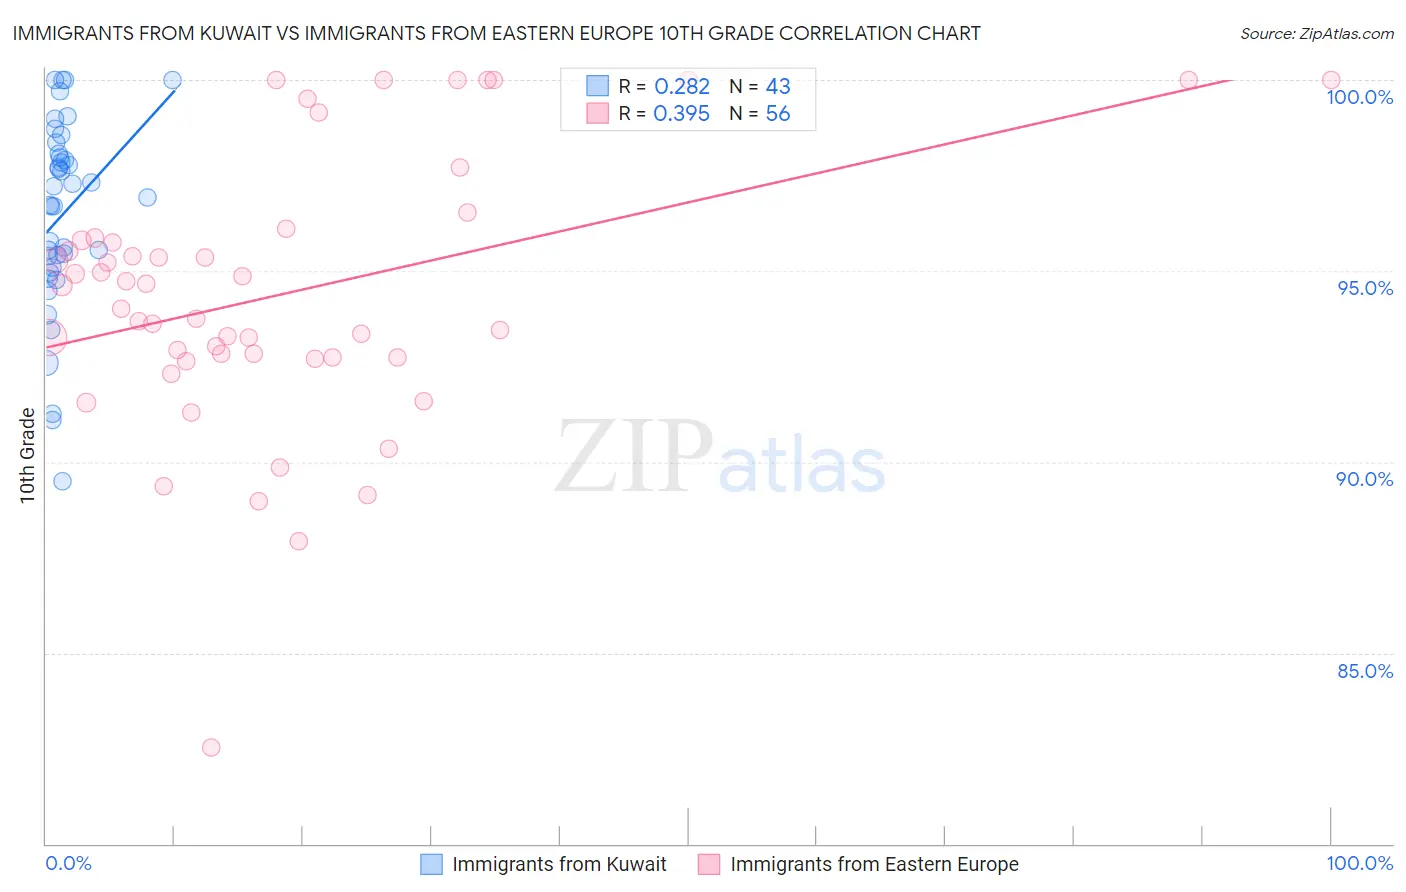
Immigrants from Kuwait vs Immigrants from Eastern Europe 10th Grade Correlation Chart
The statistical analysis conducted on geographies consisting of 136,917,085 people shows a weak positive correlation between the proportion of Immigrants from Kuwait and percentage of population with at least 10th grade education in the United States with a correlation coefficient (R) of 0.282 and weighted average of 94.4%. Similarly, the statistical analysis conducted on geographies consisting of 475,879,420 people shows a mild positive correlation between the proportion of Immigrants from Eastern Europe and percentage of population with at least 10th grade education in the United States with a correlation coefficient (R) of 0.395 and weighted average of 94.3%, a difference of 0.20%.
10th Grade Correlation Summary
| Measurement | Immigrants from Kuwait | Immigrants from Eastern Europe |
| Minimum | 89.5% | 82.5% |
| Maximum | 100.0% | 100.0% |
| Range | 10.5% | 17.5% |
| Mean | 96.5% | 94.4% |
| Median | 96.9% | 94.3% |
| Interquartile 25% (IQ1) | 95.1% | 92.7% |
| Interquartile 75% (IQ3) | 98.1% | 95.8% |
| Interquartile Range (IQR) | 3.0% | 3.1% |
| Standard Deviation (Sample) | 2.5% | 3.5% |
| Standard Deviation (Population) | 2.5% | 3.5% |
Demographics Similar to Immigrants from Kuwait and Immigrants from Eastern Europe by 10th Grade
In terms of 10th grade, the demographic groups most similar to Immigrants from Kuwait are Immigrants from Zimbabwe (94.4%, a difference of 0.010%), Palestinian (94.4%, a difference of 0.020%), German Russian (94.4%, a difference of 0.030%), Delaware (94.4%, a difference of 0.030%), and Sioux (94.4%, a difference of 0.040%). Similarly, the demographic groups most similar to Immigrants from Eastern Europe are Iroquois (94.3%, a difference of 0.010%), Immigrants from Greece (94.3%, a difference of 0.010%), Potawatomi (94.3%, a difference of 0.040%), Israeli (94.3%, a difference of 0.050%), and American (94.3%, a difference of 0.070%).
| Demographics | Rating | Rank | 10th Grade |
| Immigrants | Zimbabwe | 96.8 /100 | #111 | Exceptional 94.4% |
| Immigrants | Kuwait | 96.8 /100 | #112 | Exceptional 94.4% |
| Palestinians | 96.5 /100 | #113 | Exceptional 94.4% |
| German Russians | 96.3 /100 | #114 | Exceptional 94.4% |
| Delaware | 96.3 /100 | #115 | Exceptional 94.4% |
| Sioux | 96.2 /100 | #116 | Exceptional 94.4% |
| Immigrants | Hungary | 95.8 /100 | #117 | Exceptional 94.4% |
| Jordanians | 95.6 /100 | #118 | Exceptional 94.4% |
| Immigrants | Israel | 95.4 /100 | #119 | Exceptional 94.4% |
| Immigrants | Taiwan | 95.3 /100 | #120 | Exceptional 94.4% |
| Immigrants | Belarus | 95.2 /100 | #121 | Exceptional 94.4% |
| Inupiat | 95.1 /100 | #122 | Exceptional 94.4% |
| Cree | 95.1 /100 | #123 | Exceptional 94.4% |
| Basques | 94.9 /100 | #124 | Exceptional 94.3% |
| Americans | 94.4 /100 | #125 | Exceptional 94.3% |
| Immigrants | Iran | 94.4 /100 | #126 | Exceptional 94.3% |
| Israelis | 93.8 /100 | #127 | Exceptional 94.3% |
| Potawatomi | 93.6 /100 | #128 | Exceptional 94.3% |
| Iroquois | 92.8 /100 | #129 | Exceptional 94.3% |
| Immigrants | Greece | 92.7 /100 | #130 | Exceptional 94.3% |
| Immigrants | Eastern Europe | 92.5 /100 | #131 | Exceptional 94.3% |