Immigrants from Korea vs Yup'ik 1st Grade
COMPARE
Immigrants from Korea
Yup'ik
1st Grade
1st Grade Comparison
Immigrants from Korea
Yup'ik
97.9%
1ST GRADE
53.0/ 100
METRIC RATING
172nd/ 347
METRIC RANK
99.2%
1ST GRADE
100.0/ 100
METRIC RATING
2nd/ 347
METRIC RANK
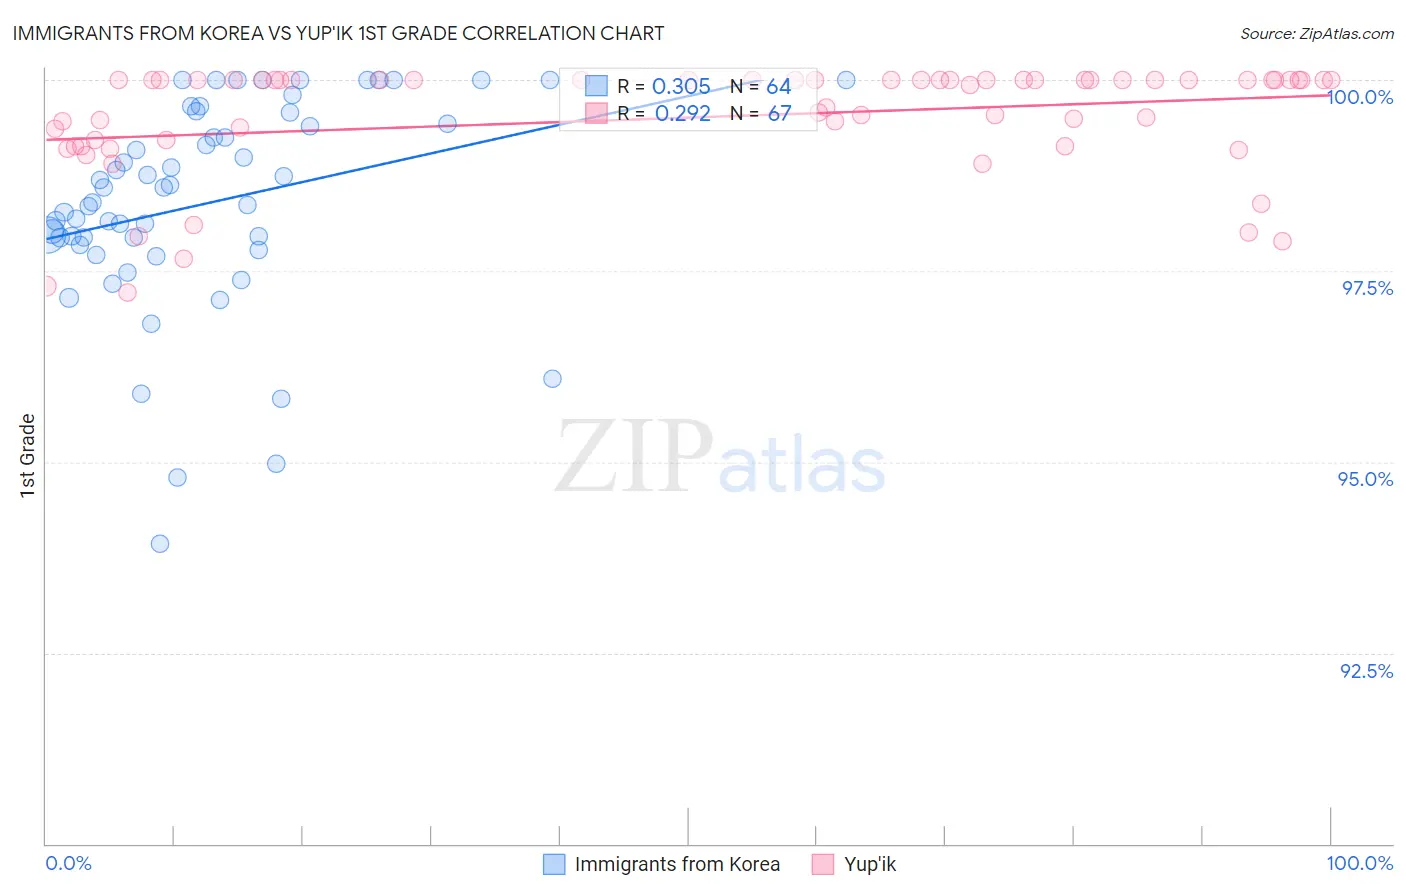
Immigrants from Korea vs Yup'ik 1st Grade Correlation Chart
The statistical analysis conducted on geographies consisting of 416,280,076 people shows a mild positive correlation between the proportion of Immigrants from Korea and percentage of population with at least 1st grade education in the United States with a correlation coefficient (R) of 0.305 and weighted average of 97.9%. Similarly, the statistical analysis conducted on geographies consisting of 39,964,464 people shows a weak positive correlation between the proportion of Yup'ik and percentage of population with at least 1st grade education in the United States with a correlation coefficient (R) of 0.292 and weighted average of 99.2%, a difference of 1.3%.
1st Grade Correlation Summary
| Measurement | Immigrants from Korea | Yup'ik |
| Minimum | 93.9% | 97.2% |
| Maximum | 100.0% | 100.0% |
| Range | 6.1% | 2.8% |
| Mean | 98.4% | 99.5% |
| Median | 98.5% | 100.0% |
| Interquartile 25% (IQ1) | 97.9% | 99.1% |
| Interquartile 75% (IQ3) | 99.5% | 100.0% |
| Interquartile Range (IQR) | 1.6% | 0.86% |
| Standard Deviation (Sample) | 1.4% | 0.73% |
| Standard Deviation (Population) | 1.4% | 0.72% |
Similar Demographics by 1st Grade
Demographics Similar to Immigrants from Korea by 1st Grade
In terms of 1st grade, the demographic groups most similar to Immigrants from Korea are Immigrants from Jordan (97.9%, a difference of 0.0%), Ugandan (97.9%, a difference of 0.010%), Navajo (97.9%, a difference of 0.010%), Bermudan (97.9%, a difference of 0.010%), and Chilean (97.9%, a difference of 0.010%).
| Demographics | Rating | Rank | 1st Grade |
| Ugandans | 56.9 /100 | #165 | Average 97.9% |
| Navajo | 56.6 /100 | #166 | Average 97.9% |
| Bermudans | 56.3 /100 | #167 | Average 97.9% |
| Chileans | 55.6 /100 | #168 | Average 97.9% |
| Immigrants | Micronesia | 55.3 /100 | #169 | Average 97.9% |
| Immigrants | Spain | 54.9 /100 | #170 | Average 97.9% |
| Immigrants | Jordan | 53.9 /100 | #171 | Average 97.9% |
| Immigrants | Korea | 53.0 /100 | #172 | Average 97.9% |
| Kenyans | 51.2 /100 | #173 | Average 97.9% |
| Natives/Alaskans | 50.0 /100 | #174 | Average 97.9% |
| Immigrants | Sri Lanka | 49.7 /100 | #175 | Average 97.9% |
| Albanians | 49.6 /100 | #176 | Average 97.9% |
| Immigrants | Brazil | 49.1 /100 | #177 | Average 97.9% |
| Immigrants | Venezuela | 47.8 /100 | #178 | Average 97.9% |
| Argentineans | 47.2 /100 | #179 | Average 97.9% |
Demographics Similar to Yup'ik by 1st Grade
In terms of 1st grade, the demographic groups most similar to Yup'ik are Inupiat (98.9%, a difference of 0.33%), Welsh (98.9%, a difference of 0.34%), Tsimshian (98.8%, a difference of 0.37%), Alaskan Athabascan (98.8%, a difference of 0.42%), and Crow (99.6%, a difference of 0.46%).
| Demographics | Rating | Rank | 1st Grade |
| Crow | 100.0 /100 | #1 | Exceptional 99.6% |
| Yup'ik | 100.0 /100 | #2 | Exceptional 99.2% |
| Inupiat | 100.0 /100 | #3 | Exceptional 98.9% |
| Welsh | 100.0 /100 | #4 | Exceptional 98.9% |
| Tsimshian | 100.0 /100 | #5 | Exceptional 98.8% |
| Alaskan Athabascans | 100.0 /100 | #6 | Exceptional 98.8% |
| Alaska Natives | 100.0 /100 | #7 | Exceptional 98.7% |
| Norwegians | 100.0 /100 | #8 | Exceptional 98.7% |
| Slovaks | 100.0 /100 | #9 | Exceptional 98.7% |
| Germans | 100.0 /100 | #10 | Exceptional 98.7% |
| Tlingit-Haida | 100.0 /100 | #11 | Exceptional 98.7% |
| Slovenes | 100.0 /100 | #12 | Exceptional 98.7% |
| Carpatho Rusyns | 100.0 /100 | #13 | Exceptional 98.6% |
| English | 100.0 /100 | #14 | Exceptional 98.6% |
| Swedes | 100.0 /100 | #15 | Exceptional 98.6% |