Immigrants from Korea vs Tohono O'odham 10th Grade
COMPARE
Immigrants from Korea
Tohono O'odham
10th Grade
10th Grade Comparison
Immigrants from Korea
Tohono O'odham
94.2%
10TH GRADE
91.3/ 100
METRIC RATING
135th/ 347
METRIC RANK
90.1%
10TH GRADE
0.0/ 100
METRIC RATING
322nd/ 347
METRIC RANK
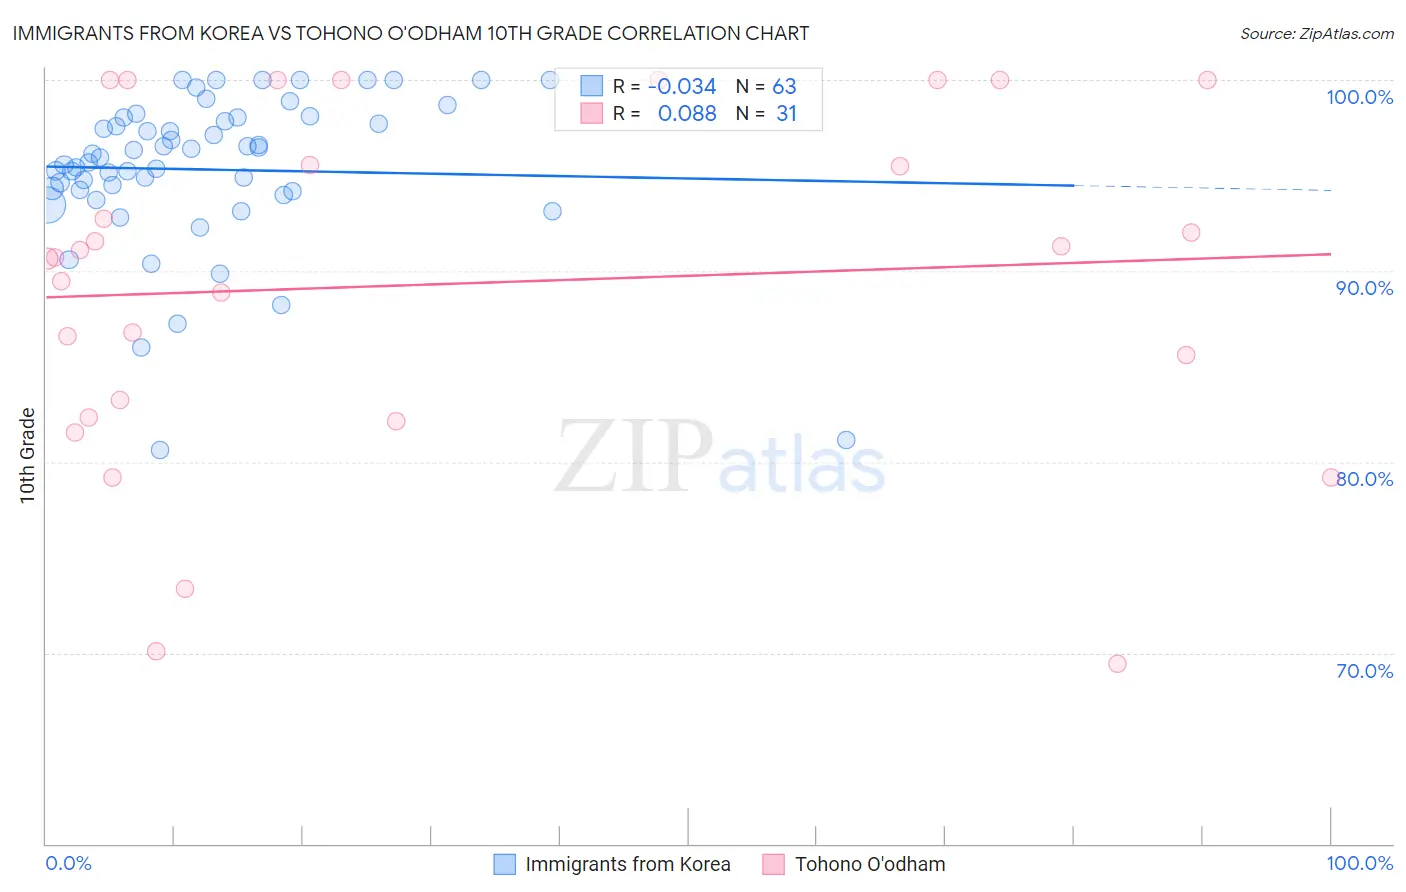
Immigrants from Korea vs Tohono O'odham 10th Grade Correlation Chart
The statistical analysis conducted on geographies consisting of 416,242,322 people shows no correlation between the proportion of Immigrants from Korea and percentage of population with at least 10th grade education in the United States with a correlation coefficient (R) of -0.034 and weighted average of 94.2%. Similarly, the statistical analysis conducted on geographies consisting of 58,730,615 people shows a slight positive correlation between the proportion of Tohono O'odham and percentage of population with at least 10th grade education in the United States with a correlation coefficient (R) of 0.088 and weighted average of 90.1%, a difference of 4.5%.
10th Grade Correlation Summary
| Measurement | Immigrants from Korea | Tohono O'odham |
| Minimum | 80.6% | 69.4% |
| Maximum | 100.0% | 100.0% |
| Range | 19.4% | 30.6% |
| Mean | 95.3% | 89.3% |
| Median | 96.0% | 90.7% |
| Interquartile 25% (IQ1) | 94.2% | 82.3% |
| Interquartile 75% (IQ3) | 98.0% | 100.0% |
| Interquartile Range (IQR) | 3.8% | 17.7% |
| Standard Deviation (Sample) | 4.1% | 9.1% |
| Standard Deviation (Population) | 4.1% | 8.9% |
Similar Demographics by 10th Grade
Demographics Similar to Immigrants from Korea by 10th Grade
In terms of 10th grade, the demographic groups most similar to Immigrants from Korea are Osage (94.2%, a difference of 0.010%), Shoshone (94.2%, a difference of 0.010%), Creek (94.2%, a difference of 0.020%), Arapaho (94.2%, a difference of 0.020%), and Immigrants from Russia (94.3%, a difference of 0.030%).
| Demographics | Rating | Rank | 10th Grade |
| Potawatomi | 93.6 /100 | #128 | Exceptional 94.3% |
| Iroquois | 92.8 /100 | #129 | Exceptional 94.3% |
| Immigrants | Greece | 92.7 /100 | #130 | Exceptional 94.3% |
| Immigrants | Eastern Europe | 92.5 /100 | #131 | Exceptional 94.3% |
| Immigrants | Russia | 92.4 /100 | #132 | Exceptional 94.3% |
| Creek | 91.9 /100 | #133 | Exceptional 94.2% |
| Osage | 91.7 /100 | #134 | Exceptional 94.2% |
| Immigrants | Korea | 91.3 /100 | #135 | Exceptional 94.2% |
| Shoshone | 90.8 /100 | #136 | Exceptional 94.2% |
| Arapaho | 90.5 /100 | #137 | Exceptional 94.2% |
| Immigrants | Sri Lanka | 89.9 /100 | #138 | Excellent 94.2% |
| Immigrants | Bosnia and Herzegovina | 89.4 /100 | #139 | Excellent 94.2% |
| Immigrants | Jordan | 87.6 /100 | #140 | Excellent 94.1% |
| Hmong | 86.6 /100 | #141 | Excellent 94.1% |
| Albanians | 86.5 /100 | #142 | Excellent 94.1% |
Demographics Similar to Tohono O'odham by 10th Grade
In terms of 10th grade, the demographic groups most similar to Tohono O'odham are Houma (90.2%, a difference of 0.010%), Belizean (90.2%, a difference of 0.010%), Nicaraguan (90.2%, a difference of 0.020%), Immigrants from Belize (90.1%, a difference of 0.090%), and Immigrants from Cuba (90.2%, a difference of 0.10%).
| Demographics | Rating | Rank | 10th Grade |
| Immigrants | Caribbean | 0.0 /100 | #315 | Tragic 90.6% |
| Ecuadorians | 0.0 /100 | #316 | Tragic 90.6% |
| Immigrants | Ecuador | 0.0 /100 | #317 | Tragic 90.4% |
| Immigrants | Cuba | 0.0 /100 | #318 | Tragic 90.2% |
| Nicaraguans | 0.0 /100 | #319 | Tragic 90.2% |
| Houma | 0.0 /100 | #320 | Tragic 90.2% |
| Belizeans | 0.0 /100 | #321 | Tragic 90.2% |
| Tohono O'odham | 0.0 /100 | #322 | Tragic 90.1% |
| Immigrants | Belize | 0.0 /100 | #323 | Tragic 90.1% |
| Immigrants | Armenia | 0.0 /100 | #324 | Tragic 89.9% |
| Puerto Ricans | 0.0 /100 | #325 | Tragic 89.8% |
| Central American Indians | 0.0 /100 | #326 | Tragic 89.7% |
| Immigrants | Nicaragua | 0.0 /100 | #327 | Tragic 89.5% |
| Immigrants | Cabo Verde | 0.0 /100 | #328 | Tragic 89.5% |
| Dominicans | 0.0 /100 | #329 | Tragic 89.4% |