Immigrants from Korea vs Arab 7th Grade
COMPARE
Immigrants from Korea
Arab
7th Grade
7th Grade Comparison
Immigrants from Korea
Arabs
96.0%
7TH GRADE
49.2/ 100
METRIC RATING
177th/ 347
METRIC RANK
96.2%
7TH GRADE
68.6/ 100
METRIC RATING
158th/ 347
METRIC RANK
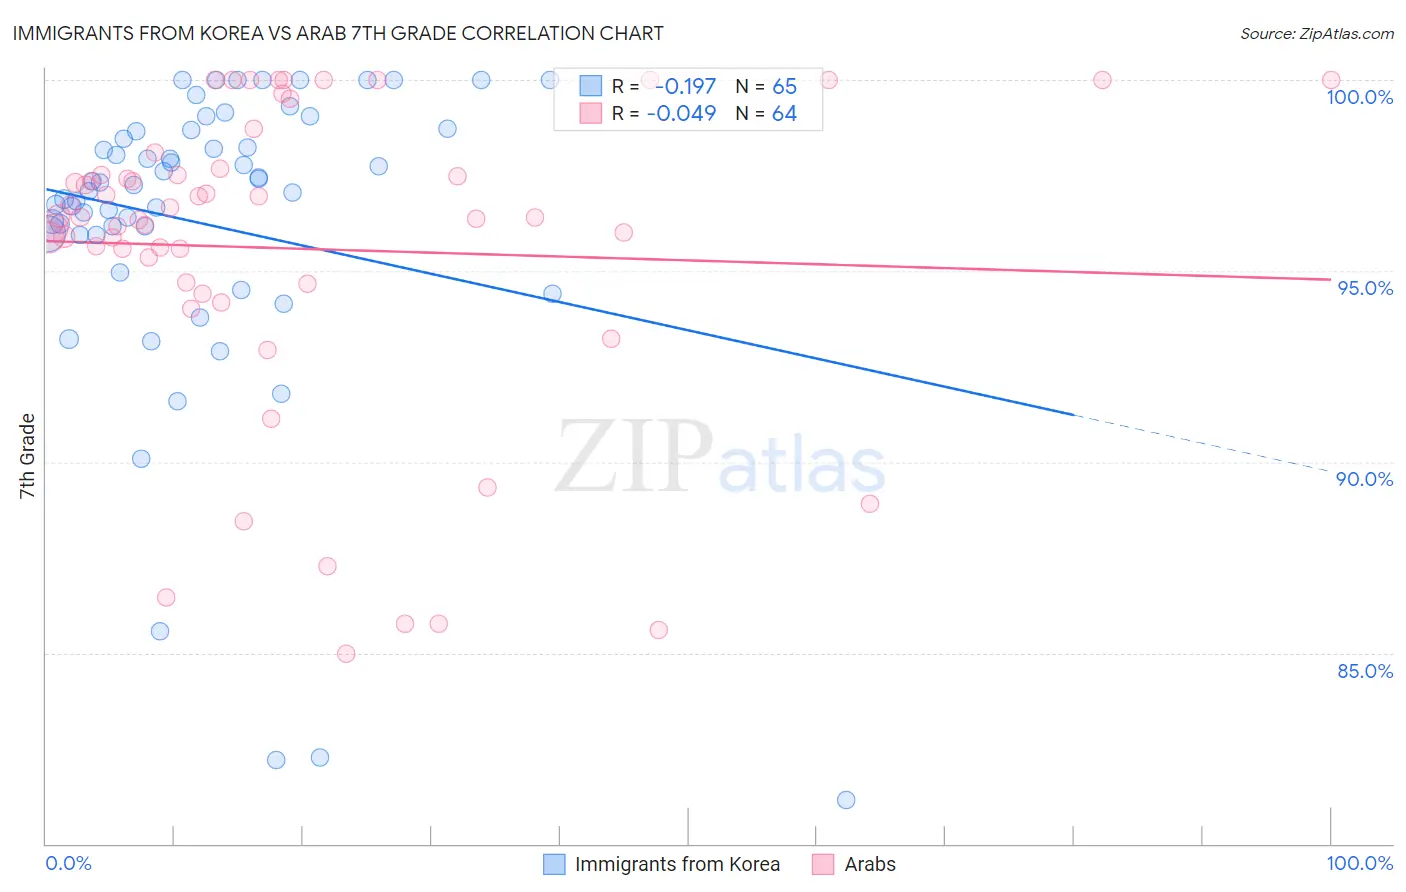
Immigrants from Korea vs Arab 7th Grade Correlation Chart
The statistical analysis conducted on geographies consisting of 416,280,217 people shows a poor negative correlation between the proportion of Immigrants from Korea and percentage of population with at least 7th grade education in the United States with a correlation coefficient (R) of -0.197 and weighted average of 96.0%. Similarly, the statistical analysis conducted on geographies consisting of 486,870,847 people shows no correlation between the proportion of Arabs and percentage of population with at least 7th grade education in the United States with a correlation coefficient (R) of -0.049 and weighted average of 96.2%, a difference of 0.13%.
7th Grade Correlation Summary
| Measurement | Immigrants from Korea | Arab |
| Minimum | 81.1% | 85.0% |
| Maximum | 100.0% | 100.0% |
| Range | 18.9% | 15.0% |
| Mean | 96.2% | 95.6% |
| Median | 97.2% | 96.4% |
| Interquartile 25% (IQ1) | 95.9% | 94.7% |
| Interquartile 75% (IQ3) | 98.7% | 97.6% |
| Interquartile Range (IQR) | 2.7% | 2.9% |
| Standard Deviation (Sample) | 4.1% | 4.1% |
| Standard Deviation (Population) | 4.1% | 4.0% |
Demographics Similar to Immigrants from Korea and Arabs by 7th Grade
In terms of 7th grade, the demographic groups most similar to Immigrants from Korea are Black/African American (96.0%, a difference of 0.0%), Chilean (96.0%, a difference of 0.0%), Venezuelan (96.0%, a difference of 0.010%), Immigrants from Albania (96.0%, a difference of 0.010%), and Mongolian (96.0%, a difference of 0.010%). Similarly, the demographic groups most similar to Arabs are Alsatian (96.1%, a difference of 0.010%), Immigrants from Kenya (96.1%, a difference of 0.010%), Bermudan (96.1%, a difference of 0.020%), Pima (96.1%, a difference of 0.030%), and Spaniard (96.1%, a difference of 0.040%).
| Demographics | Rating | Rank | 7th Grade |
| Ugandans | 75.5 /100 | #157 | Good 96.2% |
| Arabs | 68.6 /100 | #158 | Good 96.2% |
| Alsatians | 67.2 /100 | #159 | Good 96.1% |
| Immigrants | Kenya | 66.8 /100 | #160 | Good 96.1% |
| Bermudans | 66.3 /100 | #161 | Good 96.1% |
| Pima | 64.3 /100 | #162 | Good 96.1% |
| Spaniards | 62.6 /100 | #163 | Good 96.1% |
| Immigrants | Italy | 62.1 /100 | #164 | Good 96.1% |
| Immigrants | Taiwan | 61.5 /100 | #165 | Good 96.1% |
| Immigrants | Kazakhstan | 61.0 /100 | #166 | Good 96.1% |
| Immigrants | Sri Lanka | 59.9 /100 | #167 | Average 96.1% |
| Immigrants | Poland | 59.0 /100 | #168 | Average 96.1% |
| Ute | 55.8 /100 | #169 | Average 96.1% |
| Immigrants | Ukraine | 55.0 /100 | #170 | Average 96.1% |
| Egyptians | 54.2 /100 | #171 | Average 96.1% |
| Venezuelans | 51.4 /100 | #172 | Average 96.0% |
| Immigrants | Albania | 50.4 /100 | #173 | Average 96.0% |
| Mongolians | 50.0 /100 | #174 | Average 96.0% |
| Blacks/African Americans | 49.5 /100 | #175 | Average 96.0% |
| Chileans | 49.3 /100 | #176 | Average 96.0% |
| Immigrants | Korea | 49.2 /100 | #177 | Average 96.0% |