Immigrants from Kenya vs Immigrants from South Central Asia Associate's Degree
COMPARE
Immigrants from Kenya
Immigrants from South Central Asia
Associate's Degree
Associate's Degree Comparison
Immigrants from Kenya
Immigrants from South Central Asia
47.2%
ASSOCIATE'S DEGREE
72.1/ 100
METRIC RATING
154th/ 347
METRIC RANK
55.7%
ASSOCIATE'S DEGREE
100.0/ 100
METRIC RATING
12th/ 347
METRIC RANK
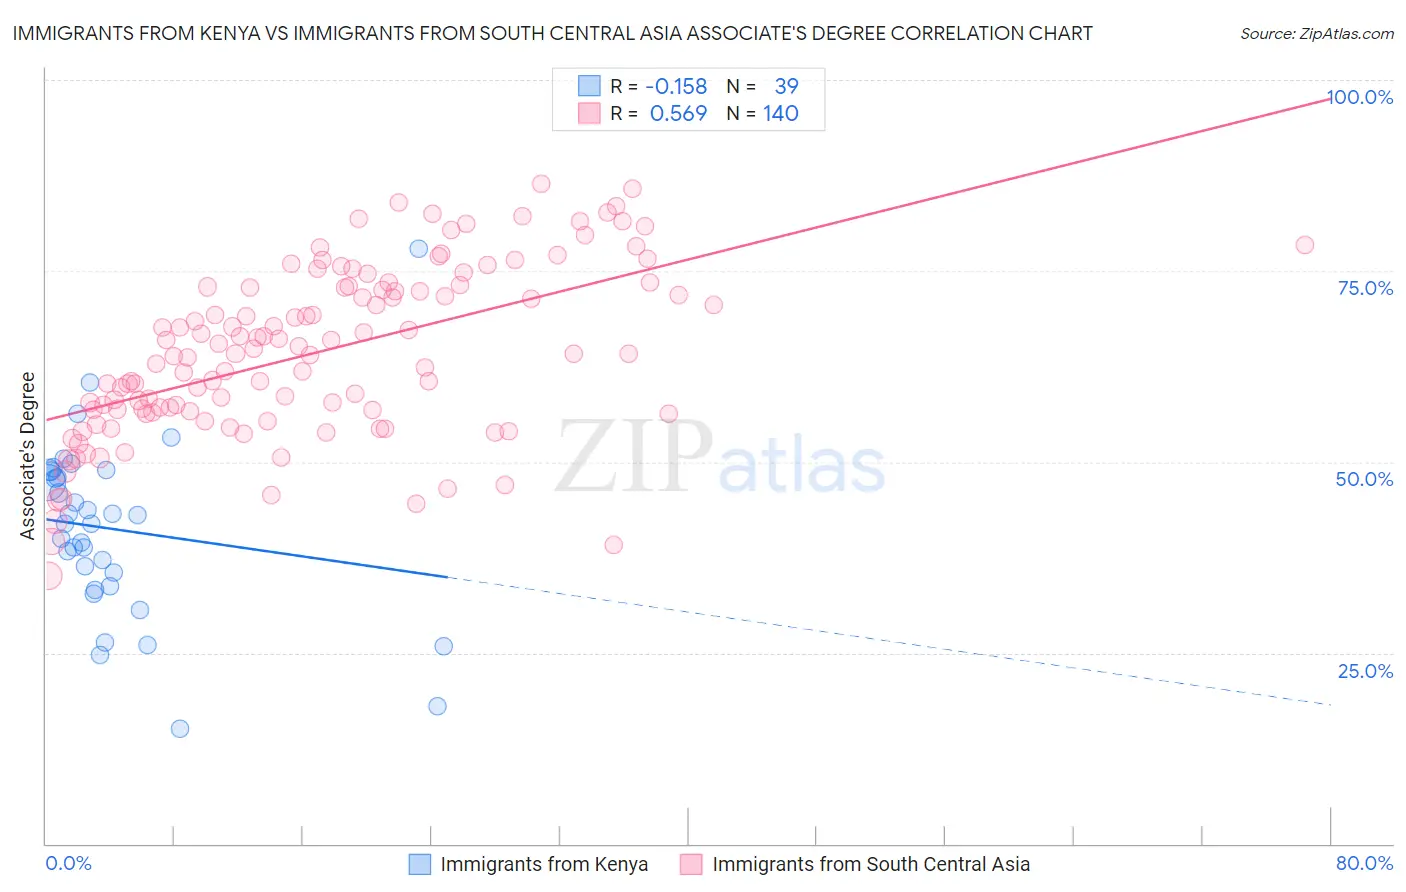
Immigrants from Kenya vs Immigrants from South Central Asia Associate's Degree Correlation Chart
The statistical analysis conducted on geographies consisting of 218,082,040 people shows a poor negative correlation between the proportion of Immigrants from Kenya and percentage of population with at least associate's degree education in the United States with a correlation coefficient (R) of -0.158 and weighted average of 47.2%. Similarly, the statistical analysis conducted on geographies consisting of 473,063,120 people shows a substantial positive correlation between the proportion of Immigrants from South Central Asia and percentage of population with at least associate's degree education in the United States with a correlation coefficient (R) of 0.569 and weighted average of 55.7%, a difference of 18.2%.
Associate's Degree Correlation Summary
| Measurement | Immigrants from Kenya | Immigrants from South Central Asia |
| Minimum | 15.0% | 35.1% |
| Maximum | 78.0% | 86.5% |
| Range | 63.0% | 51.4% |
| Mean | 41.2% | 64.4% |
| Median | 42.0% | 64.2% |
| Interquartile 25% (IQ1) | 33.7% | 56.7% |
| Interquartile 75% (IQ3) | 48.8% | 72.9% |
| Interquartile Range (IQR) | 15.1% | 16.2% |
| Standard Deviation (Sample) | 11.8% | 11.0% |
| Standard Deviation (Population) | 11.6% | 11.0% |
Similar Demographics by Associate's Degree
Demographics Similar to Immigrants from Kenya by Associate's Degree
In terms of associate's degree, the demographic groups most similar to Immigrants from Kenya are Czech (47.2%, a difference of 0.010%), Kenyan (47.1%, a difference of 0.13%), South American (47.1%, a difference of 0.14%), Sudanese (47.1%, a difference of 0.16%), and Immigrants from Afghanistan (47.3%, a difference of 0.20%).
| Demographics | Rating | Rank | Associate's Degree |
| Danes | 77.3 /100 | #147 | Good 47.4% |
| South American Indians | 76.7 /100 | #148 | Good 47.4% |
| Immigrants | Armenia | 76.6 /100 | #149 | Good 47.4% |
| Iraqis | 76.2 /100 | #150 | Good 47.4% |
| Immigrants | North Macedonia | 76.0 /100 | #151 | Good 47.4% |
| Immigrants | Afghanistan | 74.3 /100 | #152 | Good 47.3% |
| Czechs | 72.2 /100 | #153 | Good 47.2% |
| Immigrants | Kenya | 72.1 /100 | #154 | Good 47.2% |
| Kenyans | 70.6 /100 | #155 | Good 47.1% |
| South Americans | 70.5 /100 | #156 | Good 47.1% |
| Sudanese | 70.3 /100 | #157 | Good 47.1% |
| Immigrants | Germany | 69.7 /100 | #158 | Good 47.1% |
| Immigrants | Poland | 69.2 /100 | #159 | Good 47.1% |
| Scottish | 65.4 /100 | #160 | Good 46.9% |
| Scandinavians | 65.2 /100 | #161 | Good 46.9% |
Demographics Similar to Immigrants from South Central Asia by Associate's Degree
In terms of associate's degree, the demographic groups most similar to Immigrants from South Central Asia are Immigrants from Australia (55.8%, a difference of 0.12%), Immigrants from China (55.5%, a difference of 0.49%), Immigrants from Hong Kong (55.4%, a difference of 0.63%), Immigrants from Eastern Asia (55.4%, a difference of 0.67%), and Soviet Union (55.1%, a difference of 1.1%).
| Demographics | Rating | Rank | Associate's Degree |
| Iranians | 100.0 /100 | #5 | Exceptional 58.2% |
| Okinawans | 100.0 /100 | #6 | Exceptional 57.7% |
| Immigrants | Iran | 100.0 /100 | #7 | Exceptional 57.7% |
| Thais | 100.0 /100 | #8 | Exceptional 57.4% |
| Immigrants | Israel | 100.0 /100 | #9 | Exceptional 56.8% |
| Cypriots | 100.0 /100 | #10 | Exceptional 56.4% |
| Immigrants | Australia | 100.0 /100 | #11 | Exceptional 55.8% |
| Immigrants | South Central Asia | 100.0 /100 | #12 | Exceptional 55.7% |
| Immigrants | China | 100.0 /100 | #13 | Exceptional 55.5% |
| Immigrants | Hong Kong | 100.0 /100 | #14 | Exceptional 55.4% |
| Immigrants | Eastern Asia | 100.0 /100 | #15 | Exceptional 55.4% |
| Soviet Union | 100.0 /100 | #16 | Exceptional 55.1% |
| Eastern Europeans | 100.0 /100 | #17 | Exceptional 55.0% |
| Indians (Asian) | 100.0 /100 | #18 | Exceptional 54.8% |
| Immigrants | Ireland | 100.0 /100 | #19 | Exceptional 54.7% |