Immigrants from Kenya vs Immigrants from Romania 12th Grade, No Diploma
COMPARE
Immigrants from Kenya
Immigrants from Romania
12th Grade, No Diploma
12th Grade, No Diploma Comparison
Immigrants from Kenya
Immigrants from Romania
91.5%
12TH GRADE, NO DIPLOMA
73.9/ 100
METRIC RATING
154th/ 347
METRIC RANK
92.3%
12TH GRADE, NO DIPLOMA
98.5/ 100
METRIC RATING
92nd/ 347
METRIC RANK
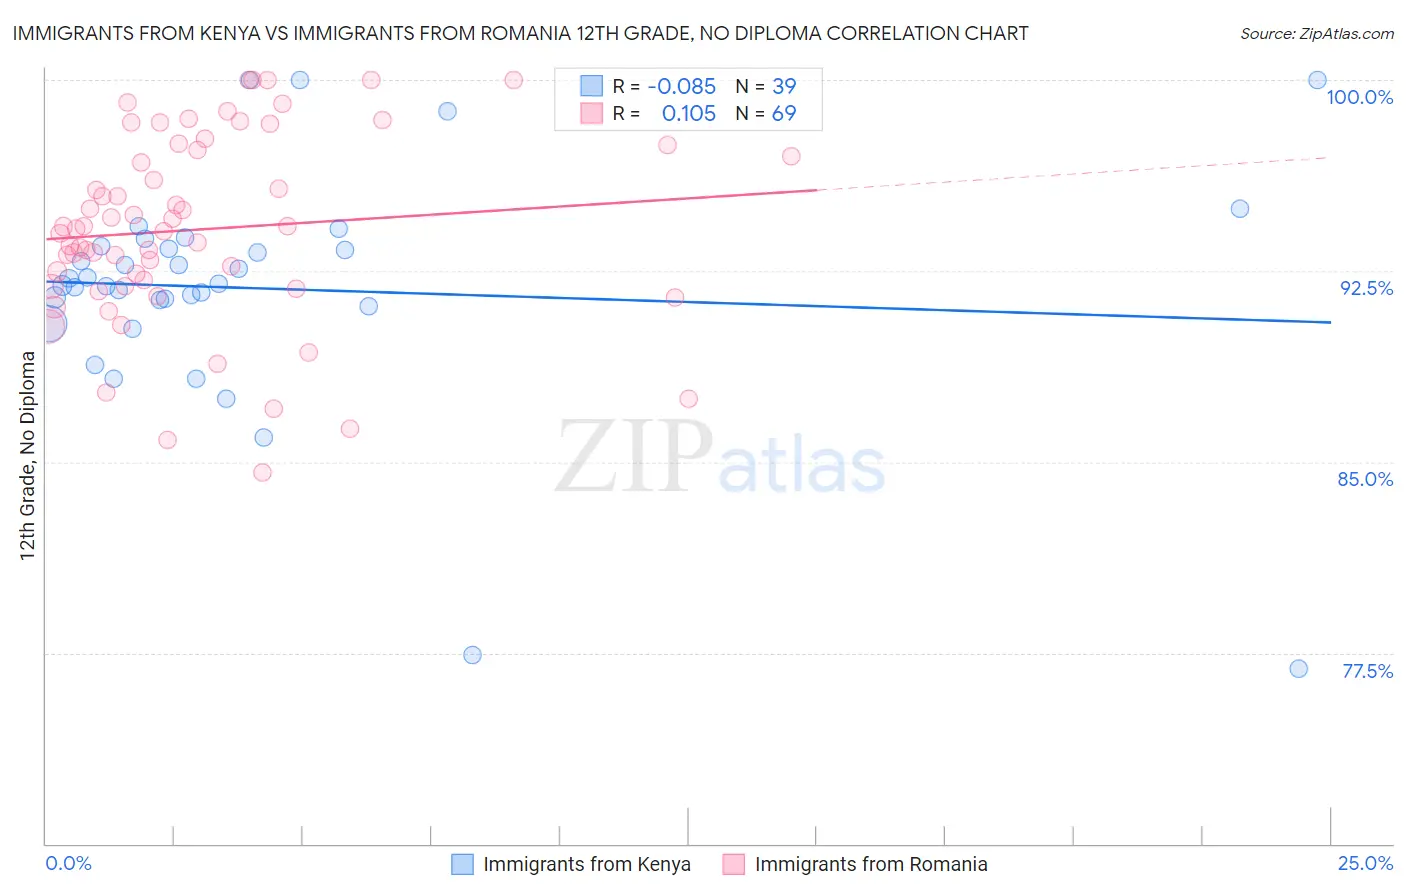
Immigrants from Kenya vs Immigrants from Romania 12th Grade, No Diploma Correlation Chart
The statistical analysis conducted on geographies consisting of 218,076,690 people shows a slight negative correlation between the proportion of Immigrants from Kenya and percentage of population with at least 12th grade (no diploma) education in the United States with a correlation coefficient (R) of -0.085 and weighted average of 91.5%. Similarly, the statistical analysis conducted on geographies consisting of 257,013,351 people shows a poor positive correlation between the proportion of Immigrants from Romania and percentage of population with at least 12th grade (no diploma) education in the United States with a correlation coefficient (R) of 0.105 and weighted average of 92.3%, a difference of 0.97%.
12th Grade, No Diploma Correlation Summary
| Measurement | Immigrants from Kenya | Immigrants from Romania |
| Minimum | 76.9% | 84.6% |
| Maximum | 100.0% | 100.0% |
| Range | 23.1% | 15.4% |
| Mean | 91.8% | 94.1% |
| Median | 92.0% | 94.1% |
| Interquartile 25% (IQ1) | 91.1% | 91.9% |
| Interquartile 75% (IQ3) | 93.5% | 97.3% |
| Interquartile Range (IQR) | 2.4% | 5.4% |
| Standard Deviation (Sample) | 4.6% | 3.7% |
| Standard Deviation (Population) | 4.6% | 3.7% |
Similar Demographics by 12th Grade, No Diploma
Demographics Similar to Immigrants from Kenya by 12th Grade, No Diploma
In terms of 12th grade, no diploma, the demographic groups most similar to Immigrants from Kenya are Immigrants from Iraq (91.4%, a difference of 0.010%), Iraqi (91.5%, a difference of 0.020%), Asian (91.4%, a difference of 0.030%), Immigrants from Pakistan (91.4%, a difference of 0.050%), and Kenyan (91.5%, a difference of 0.060%).
| Demographics | Rating | Rank | 12th Grade, No Diploma |
| Pakistanis | 79.6 /100 | #147 | Good 91.5% |
| Indians (Asian) | 79.4 /100 | #148 | Good 91.5% |
| Ugandans | 79.0 /100 | #149 | Good 91.5% |
| Paraguayans | 78.9 /100 | #150 | Good 91.5% |
| Chippewa | 78.8 /100 | #151 | Good 91.5% |
| Kenyans | 77.4 /100 | #152 | Good 91.5% |
| Iraqis | 75.3 /100 | #153 | Good 91.5% |
| Immigrants | Kenya | 73.9 /100 | #154 | Good 91.5% |
| Immigrants | Iraq | 73.0 /100 | #155 | Good 91.4% |
| Asians | 71.9 /100 | #156 | Good 91.4% |
| Immigrants | Pakistan | 70.7 /100 | #157 | Good 91.4% |
| Immigrants | Northern Africa | 66.2 /100 | #158 | Good 91.4% |
| Laotians | 64.4 /100 | #159 | Good 91.3% |
| Immigrants | Albania | 64.1 /100 | #160 | Good 91.3% |
| Immigrants | Hong Kong | 63.8 /100 | #161 | Good 91.3% |
Demographics Similar to Immigrants from Romania by 12th Grade, No Diploma
In terms of 12th grade, no diploma, the demographic groups most similar to Immigrants from Romania are Immigrants from Western Europe (92.3%, a difference of 0.0%), South African (92.4%, a difference of 0.010%), Immigrants from Europe (92.3%, a difference of 0.010%), Immigrants from Serbia (92.4%, a difference of 0.020%), and Immigrants from North Macedonia (92.3%, a difference of 0.020%).
| Demographics | Rating | Rank | 12th Grade, No Diploma |
| Immigrants | Saudi Arabia | 99.0 /100 | #85 | Exceptional 92.5% |
| Immigrants | Turkey | 98.9 /100 | #86 | Exceptional 92.4% |
| Immigrants | France | 98.8 /100 | #87 | Exceptional 92.4% |
| Scotch-Irish | 98.8 /100 | #88 | Exceptional 92.4% |
| Canadians | 98.7 /100 | #89 | Exceptional 92.4% |
| Immigrants | Serbia | 98.6 /100 | #90 | Exceptional 92.4% |
| South Africans | 98.6 /100 | #91 | Exceptional 92.4% |
| Immigrants | Romania | 98.5 /100 | #92 | Exceptional 92.3% |
| Immigrants | Western Europe | 98.5 /100 | #93 | Exceptional 92.3% |
| Immigrants | Europe | 98.5 /100 | #94 | Exceptional 92.3% |
| Immigrants | North Macedonia | 98.5 /100 | #95 | Exceptional 92.3% |
| Icelanders | 98.5 /100 | #96 | Exceptional 92.3% |
| Celtics | 98.4 /100 | #97 | Exceptional 92.3% |
| Immigrants | Kuwait | 98.4 /100 | #98 | Exceptional 92.3% |
| Immigrants | Korea | 98.3 /100 | #99 | Exceptional 92.3% |