Immigrants from Kenya vs Immigrants from North Macedonia 2nd Grade
COMPARE
Immigrants from Kenya
Immigrants from North Macedonia
2nd Grade
2nd Grade Comparison
Immigrants from Kenya
Immigrants from North Macedonia
97.8%
2ND GRADE
26.4/ 100
METRIC RATING
196th/ 347
METRIC RANK
97.9%
2ND GRADE
68.5/ 100
METRIC RATING
152nd/ 347
METRIC RANK
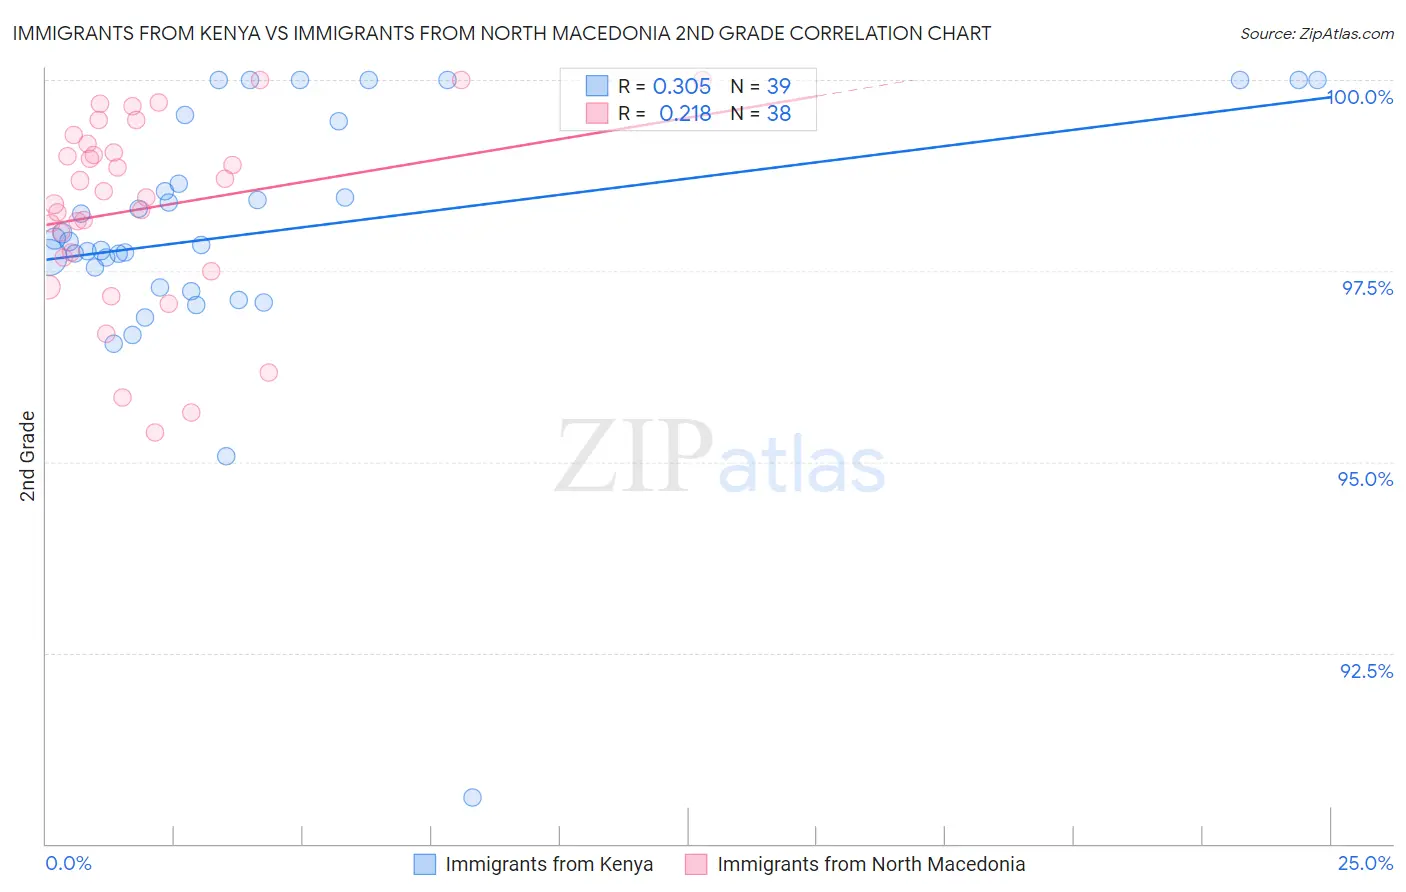
Immigrants from Kenya vs Immigrants from North Macedonia 2nd Grade Correlation Chart
The statistical analysis conducted on geographies consisting of 218,076,690 people shows a mild positive correlation between the proportion of Immigrants from Kenya and percentage of population with at least 2nd grade education in the United States with a correlation coefficient (R) of 0.305 and weighted average of 97.8%. Similarly, the statistical analysis conducted on geographies consisting of 74,317,186 people shows a weak positive correlation between the proportion of Immigrants from North Macedonia and percentage of population with at least 2nd grade education in the United States with a correlation coefficient (R) of 0.218 and weighted average of 97.9%, a difference of 0.14%.
2nd Grade Correlation Summary
| Measurement | Immigrants from Kenya | Immigrants from North Macedonia |
| Minimum | 90.6% | 95.4% |
| Maximum | 100.0% | 100.0% |
| Range | 9.4% | 4.6% |
| Mean | 98.0% | 98.3% |
| Median | 97.9% | 98.5% |
| Interquartile 25% (IQ1) | 97.3% | 97.7% |
| Interquartile 75% (IQ3) | 99.5% | 99.2% |
| Interquartile Range (IQR) | 2.2% | 1.5% |
| Standard Deviation (Sample) | 1.7% | 1.2% |
| Standard Deviation (Population) | 1.7% | 1.2% |
Similar Demographics by 2nd Grade
Demographics Similar to Immigrants from Kenya by 2nd Grade
In terms of 2nd grade, the demographic groups most similar to Immigrants from Kenya are Paiute (97.8%, a difference of 0.0%), Mongolian (97.8%, a difference of 0.0%), Immigrants from Uganda (97.8%, a difference of 0.0%), Guamanian/Chamorro (97.8%, a difference of 0.0%), and Black/African American (97.8%, a difference of 0.010%).
| Demographics | Rating | Rank | 2nd Grade |
| Panamanians | 33.5 /100 | #189 | Fair 97.8% |
| Immigrants | Taiwan | 31.8 /100 | #190 | Fair 97.8% |
| Paraguayans | 30.8 /100 | #191 | Fair 97.8% |
| Blacks/African Americans | 29.9 /100 | #192 | Fair 97.8% |
| Hawaiians | 28.5 /100 | #193 | Fair 97.8% |
| Paiute | 27.0 /100 | #194 | Fair 97.8% |
| Mongolians | 26.7 /100 | #195 | Fair 97.8% |
| Immigrants | Kenya | 26.4 /100 | #196 | Fair 97.8% |
| Immigrants | Uganda | 26.3 /100 | #197 | Fair 97.8% |
| Guamanians/Chamorros | 25.7 /100 | #198 | Fair 97.8% |
| Immigrants | Egypt | 24.4 /100 | #199 | Fair 97.8% |
| Immigrants | Lebanon | 20.9 /100 | #200 | Fair 97.8% |
| Tohono O'odham | 20.9 /100 | #201 | Fair 97.8% |
| Immigrants | Ukraine | 20.5 /100 | #202 | Fair 97.8% |
| Yuman | 20.0 /100 | #203 | Fair 97.8% |
Demographics Similar to Immigrants from North Macedonia by 2nd Grade
In terms of 2nd grade, the demographic groups most similar to Immigrants from North Macedonia are Immigrants from South Central Asia (97.9%, a difference of 0.0%), Marshallese (97.9%, a difference of 0.0%), Soviet Union (97.9%, a difference of 0.010%), French American Indian (97.9%, a difference of 0.010%), and Jordanian (98.0%, a difference of 0.020%).
| Demographics | Rating | Rank | 2nd Grade |
| Filipinos | 79.2 /100 | #145 | Good 98.0% |
| Immigrants | Israel | 78.0 /100 | #146 | Good 98.0% |
| Immigrants | Greece | 76.8 /100 | #147 | Good 98.0% |
| Jordanians | 74.5 /100 | #148 | Good 98.0% |
| Apache | 74.0 /100 | #149 | Good 97.9% |
| Immigrants | Moldova | 72.9 /100 | #150 | Good 97.9% |
| Soviet Union | 70.7 /100 | #151 | Good 97.9% |
| Immigrants | North Macedonia | 68.5 /100 | #152 | Good 97.9% |
| Immigrants | South Central Asia | 68.3 /100 | #153 | Good 97.9% |
| Marshallese | 67.7 /100 | #154 | Good 97.9% |
| French American Indians | 64.3 /100 | #155 | Good 97.9% |
| Dutch West Indians | 63.8 /100 | #156 | Good 97.9% |
| Venezuelans | 63.3 /100 | #157 | Good 97.9% |
| Immigrants | Iran | 62.8 /100 | #158 | Good 97.9% |
| Comanche | 62.8 /100 | #159 | Good 97.9% |