Immigrants from Kenya vs Immigrants from Caribbean 10th Grade
COMPARE
Immigrants from Kenya
Immigrants from Caribbean
10th Grade
10th Grade Comparison
Immigrants from Kenya
Immigrants from Caribbean
94.0%
10TH GRADE
75.3/ 100
METRIC RATING
154th/ 347
METRIC RANK
90.6%
10TH GRADE
0.0/ 100
METRIC RATING
315th/ 347
METRIC RANK
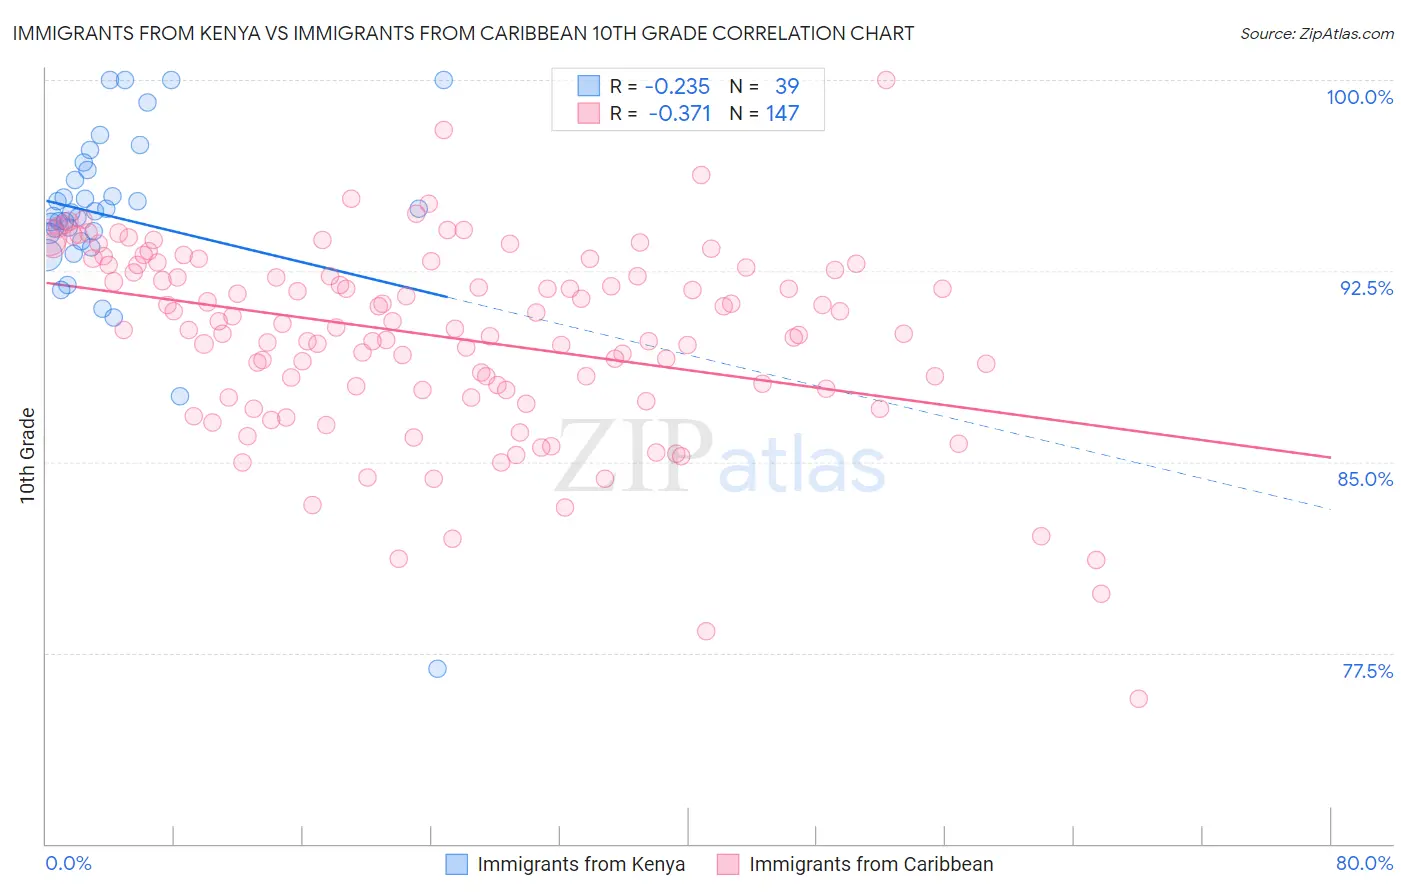
Immigrants from Kenya vs Immigrants from Caribbean 10th Grade Correlation Chart
The statistical analysis conducted on geographies consisting of 218,076,690 people shows a weak negative correlation between the proportion of Immigrants from Kenya and percentage of population with at least 10th grade education in the United States with a correlation coefficient (R) of -0.235 and weighted average of 94.0%. Similarly, the statistical analysis conducted on geographies consisting of 450,064,654 people shows a mild negative correlation between the proportion of Immigrants from Caribbean and percentage of population with at least 10th grade education in the United States with a correlation coefficient (R) of -0.371 and weighted average of 90.6%, a difference of 3.7%.
10th Grade Correlation Summary
| Measurement | Immigrants from Kenya | Immigrants from Caribbean |
| Minimum | 76.9% | 75.7% |
| Maximum | 100.0% | 100.0% |
| Range | 23.1% | 24.3% |
| Mean | 94.6% | 89.9% |
| Median | 94.8% | 90.3% |
| Interquartile 25% (IQ1) | 93.6% | 87.8% |
| Interquartile 75% (IQ3) | 96.4% | 92.7% |
| Interquartile Range (IQR) | 2.8% | 4.9% |
| Standard Deviation (Sample) | 3.9% | 3.8% |
| Standard Deviation (Population) | 3.9% | 3.8% |
Similar Demographics by 10th Grade
Demographics Similar to Immigrants from Kenya by 10th Grade
In terms of 10th grade, the demographic groups most similar to Immigrants from Kenya are Immigrants from Brazil (94.0%, a difference of 0.0%), Spanish (94.0%, a difference of 0.0%), Mongolian (94.0%, a difference of 0.010%), Kiowa (93.9%, a difference of 0.020%), and Immigrants from Italy (94.0%, a difference of 0.030%).
| Demographics | Rating | Rank | 10th Grade |
| Immigrants | Ukraine | 81.5 /100 | #147 | Excellent 94.0% |
| Arabs | 80.9 /100 | #148 | Excellent 94.0% |
| Ugandans | 80.7 /100 | #149 | Excellent 94.0% |
| Egyptians | 79.6 /100 | #150 | Good 94.0% |
| Kenyans | 79.1 /100 | #151 | Good 94.0% |
| Immigrants | Italy | 78.0 /100 | #152 | Good 94.0% |
| Immigrants | Brazil | 75.5 /100 | #153 | Good 94.0% |
| Immigrants | Kenya | 75.3 /100 | #154 | Good 94.0% |
| Spanish | 74.9 /100 | #155 | Good 94.0% |
| Mongolians | 74.4 /100 | #156 | Good 94.0% |
| Kiowa | 73.3 /100 | #157 | Good 93.9% |
| Bermudans | 71.0 /100 | #158 | Good 93.9% |
| Chileans | 70.2 /100 | #159 | Good 93.9% |
| Pakistanis | 70.1 /100 | #160 | Good 93.9% |
| Assyrians/Chaldeans/Syriacs | 69.7 /100 | #161 | Good 93.9% |
Demographics Similar to Immigrants from Caribbean by 10th Grade
In terms of 10th grade, the demographic groups most similar to Immigrants from Caribbean are Ecuadorian (90.6%, a difference of 0.010%), Nepalese (90.7%, a difference of 0.080%), Cape Verdean (90.8%, a difference of 0.16%), Immigrants from Ecuador (90.4%, a difference of 0.18%), and Immigrants from Portugal (90.8%, a difference of 0.19%).
| Demographics | Rating | Rank | 10th Grade |
| Immigrants | Bangladesh | 0.0 /100 | #308 | Tragic 91.0% |
| Immigrants | Immigrants | 0.0 /100 | #309 | Tragic 91.0% |
| Vietnamese | 0.0 /100 | #310 | Tragic 90.9% |
| Immigrants | Cambodia | 0.0 /100 | #311 | Tragic 90.9% |
| Immigrants | Portugal | 0.0 /100 | #312 | Tragic 90.8% |
| Cape Verdeans | 0.0 /100 | #313 | Tragic 90.8% |
| Nepalese | 0.0 /100 | #314 | Tragic 90.7% |
| Immigrants | Caribbean | 0.0 /100 | #315 | Tragic 90.6% |
| Ecuadorians | 0.0 /100 | #316 | Tragic 90.6% |
| Immigrants | Ecuador | 0.0 /100 | #317 | Tragic 90.4% |
| Immigrants | Cuba | 0.0 /100 | #318 | Tragic 90.2% |
| Nicaraguans | 0.0 /100 | #319 | Tragic 90.2% |
| Houma | 0.0 /100 | #320 | Tragic 90.2% |
| Belizeans | 0.0 /100 | #321 | Tragic 90.2% |
| Tohono O'odham | 0.0 /100 | #322 | Tragic 90.1% |