Immigrants from Kazakhstan vs Croatian High School Diploma
COMPARE
Immigrants from Kazakhstan
Croatian
High School Diploma
High School Diploma Comparison
Immigrants from Kazakhstan
Croatians
90.0%
HIGH SCHOOL DIPLOMA
93.4/ 100
METRIC RATING
122nd/ 347
METRIC RANK
92.0%
HIGH SCHOOL DIPLOMA
100.0/ 100
METRIC RATING
10th/ 347
METRIC RANK
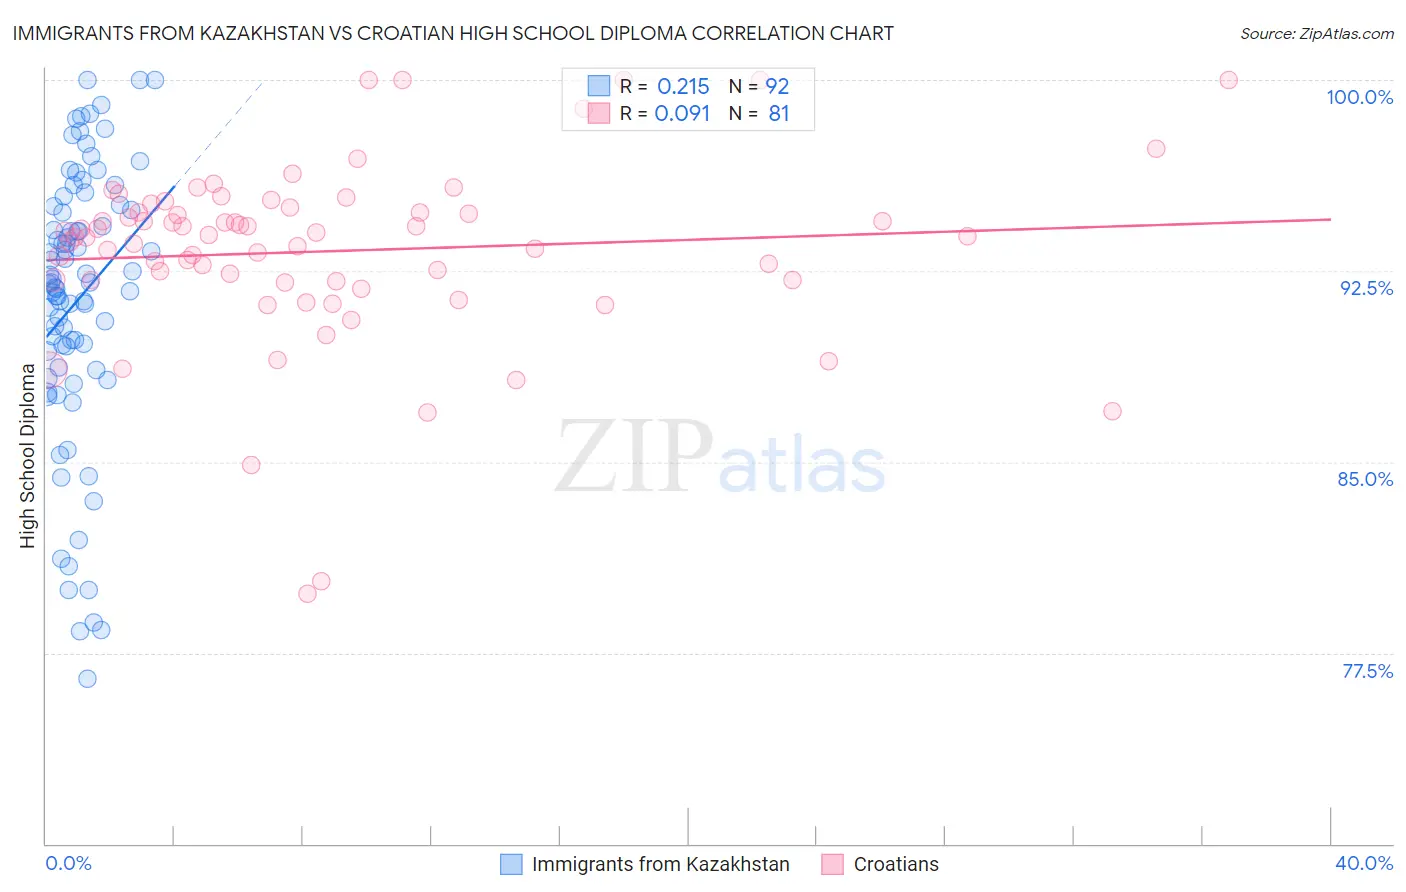
Immigrants from Kazakhstan vs Croatian High School Diploma Correlation Chart
The statistical analysis conducted on geographies consisting of 124,444,172 people shows a weak positive correlation between the proportion of Immigrants from Kazakhstan and percentage of population with at least high school diploma education in the United States with a correlation coefficient (R) of 0.215 and weighted average of 90.0%. Similarly, the statistical analysis conducted on geographies consisting of 375,733,787 people shows a slight positive correlation between the proportion of Croatians and percentage of population with at least high school diploma education in the United States with a correlation coefficient (R) of 0.091 and weighted average of 92.0%, a difference of 2.1%.
High School Diploma Correlation Summary
| Measurement | Immigrants from Kazakhstan | Croatian |
| Minimum | 76.5% | 79.8% |
| Maximum | 100.0% | 100.0% |
| Range | 23.5% | 20.2% |
| Mean | 91.4% | 93.3% |
| Median | 92.0% | 93.9% |
| Interquartile 25% (IQ1) | 89.0% | 92.1% |
| Interquartile 75% (IQ3) | 95.0% | 94.9% |
| Interquartile Range (IQR) | 5.9% | 2.8% |
| Standard Deviation (Sample) | 5.4% | 3.6% |
| Standard Deviation (Population) | 5.3% | 3.6% |
Similar Demographics by High School Diploma
Demographics Similar to Immigrants from Kazakhstan by High School Diploma
In terms of high school diploma, the demographic groups most similar to Immigrants from Kazakhstan are White/Caucasian (90.1%, a difference of 0.050%), Ottawa (90.1%, a difference of 0.070%), German Russian (90.0%, a difference of 0.080%), Immigrants from Eastern Europe (90.1%, a difference of 0.10%), and Mongolian (89.9%, a difference of 0.10%).
| Demographics | Rating | Rank | High School Diploma |
| Immigrants | Hungary | 95.8 /100 | #115 | Exceptional 90.2% |
| Immigrants | Germany | 95.7 /100 | #116 | Exceptional 90.2% |
| Jordanians | 95.4 /100 | #117 | Exceptional 90.2% |
| Israelis | 95.1 /100 | #118 | Exceptional 90.1% |
| Immigrants | Eastern Europe | 94.9 /100 | #119 | Exceptional 90.1% |
| Ottawa | 94.4 /100 | #120 | Exceptional 90.1% |
| Whites/Caucasians | 94.1 /100 | #121 | Exceptional 90.1% |
| Immigrants | Kazakhstan | 93.4 /100 | #122 | Exceptional 90.0% |
| German Russians | 92.0 /100 | #123 | Exceptional 90.0% |
| Mongolians | 91.6 /100 | #124 | Exceptional 89.9% |
| Egyptians | 91.1 /100 | #125 | Exceptional 89.9% |
| Alaska Natives | 91.0 /100 | #126 | Exceptional 89.9% |
| Immigrants | Eastern Asia | 89.2 /100 | #127 | Excellent 89.9% |
| Puget Sound Salish | 89.1 /100 | #128 | Excellent 89.9% |
| Basques | 88.5 /100 | #129 | Excellent 89.8% |
Demographics Similar to Croatians by High School Diploma
In terms of high school diploma, the demographic groups most similar to Croatians are Latvian (92.0%, a difference of 0.030%), Chinese (92.0%, a difference of 0.050%), Slovak (92.0%, a difference of 0.060%), Immigrants from India (92.0%, a difference of 0.060%), and Eastern European (91.9%, a difference of 0.070%).
| Demographics | Rating | Rank | High School Diploma |
| Carpatho Rusyns | 100.0 /100 | #3 | Exceptional 92.1% |
| Lithuanians | 100.0 /100 | #4 | Exceptional 92.0% |
| Slovenes | 100.0 /100 | #5 | Exceptional 92.0% |
| Slovaks | 100.0 /100 | #6 | Exceptional 92.0% |
| Immigrants | India | 100.0 /100 | #7 | Exceptional 92.0% |
| Chinese | 100.0 /100 | #8 | Exceptional 92.0% |
| Latvians | 100.0 /100 | #9 | Exceptional 92.0% |
| Croatians | 100.0 /100 | #10 | Exceptional 92.0% |
| Eastern Europeans | 100.0 /100 | #11 | Exceptional 91.9% |
| Poles | 100.0 /100 | #12 | Exceptional 91.9% |
| Danes | 100.0 /100 | #13 | Exceptional 91.8% |
| Bulgarians | 100.0 /100 | #14 | Exceptional 91.8% |
| Luxembourgers | 100.0 /100 | #15 | Exceptional 91.7% |
| Finns | 100.0 /100 | #16 | Exceptional 91.7% |
| Immigrants | Singapore | 99.9 /100 | #17 | Exceptional 91.7% |