Immigrants from Jordan vs Spaniard 3rd Grade
COMPARE
Immigrants from Jordan
Spaniard
3rd Grade
3rd Grade Comparison
Immigrants from Jordan
Spaniards
97.8%
3RD GRADE
57.9/ 100
METRIC RATING
162nd/ 347
METRIC RANK
97.9%
3RD GRADE
87.9/ 100
METRIC RATING
136th/ 347
METRIC RANK
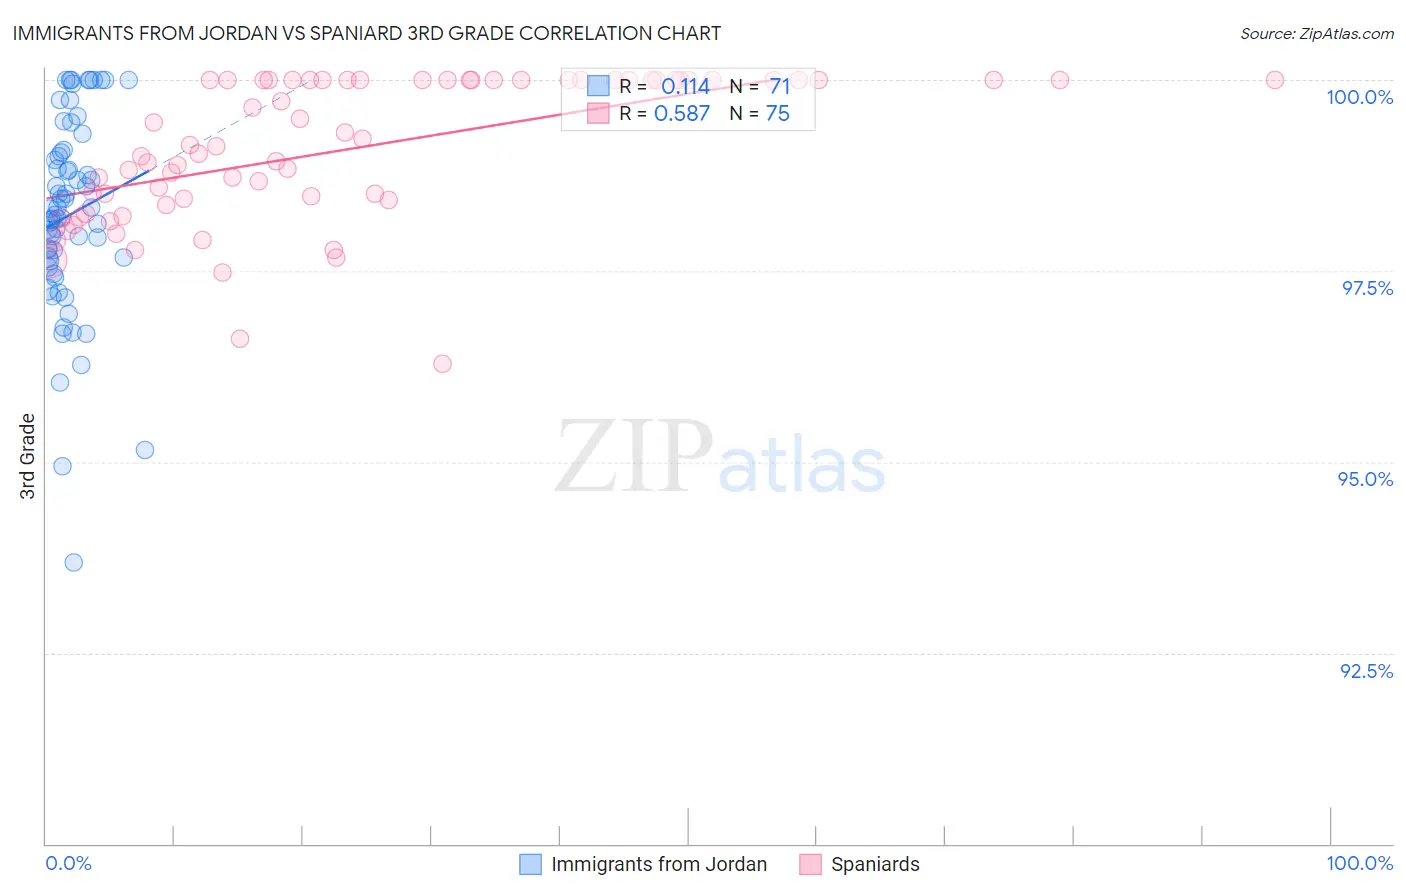
Immigrants from Jordan vs Spaniard 3rd Grade Correlation Chart
The statistical analysis conducted on geographies consisting of 181,269,915 people shows a poor positive correlation between the proportion of Immigrants from Jordan and percentage of population with at least 3rd grade education in the United States with a correlation coefficient (R) of 0.114 and weighted average of 97.8%. Similarly, the statistical analysis conducted on geographies consisting of 443,544,503 people shows a substantial positive correlation between the proportion of Spaniards and percentage of population with at least 3rd grade education in the United States with a correlation coefficient (R) of 0.587 and weighted average of 97.9%, a difference of 0.14%.
3rd Grade Correlation Summary
| Measurement | Immigrants from Jordan | Spaniard |
| Minimum | 93.7% | 96.3% |
| Maximum | 100.0% | 100.0% |
| Range | 6.3% | 3.7% |
| Mean | 98.2% | 99.1% |
| Median | 98.2% | 99.2% |
| Interquartile 25% (IQ1) | 97.6% | 98.4% |
| Interquartile 75% (IQ3) | 99.1% | 100.0% |
| Interquartile Range (IQR) | 1.4% | 1.6% |
| Standard Deviation (Sample) | 1.3% | 0.94% |
| Standard Deviation (Population) | 1.3% | 0.93% |
Similar Demographics by 3rd Grade
Demographics Similar to Immigrants from Jordan by 3rd Grade
In terms of 3rd grade, the demographic groups most similar to Immigrants from Jordan are Immigrants from Iran (97.8%, a difference of 0.0%), Albanian (97.8%, a difference of 0.0%), Marshallese (97.8%, a difference of 0.0%), Immigrants from Russia (97.8%, a difference of 0.010%), and Immigrants from Italy (97.8%, a difference of 0.010%).
| Demographics | Rating | Rank | 3rd Grade |
| Bermudans | 62.6 /100 | #155 | Good 97.8% |
| Immigrants | Russia | 61.7 /100 | #156 | Good 97.8% |
| Immigrants | Italy | 61.2 /100 | #157 | Good 97.8% |
| Venezuelans | 60.9 /100 | #158 | Good 97.8% |
| French American Indians | 60.0 /100 | #159 | Average 97.8% |
| Immigrants | Iran | 59.1 /100 | #160 | Average 97.8% |
| Albanians | 58.8 /100 | #161 | Average 97.8% |
| Immigrants | Jordan | 57.9 /100 | #162 | Average 97.8% |
| Marshallese | 57.2 /100 | #163 | Average 97.8% |
| Immigrants | Bosnia and Herzegovina | 56.2 /100 | #164 | Average 97.8% |
| Ugandans | 56.1 /100 | #165 | Average 97.8% |
| Dutch West Indians | 55.5 /100 | #166 | Average 97.8% |
| Chileans | 55.3 /100 | #167 | Average 97.8% |
| Immigrants | Spain | 54.3 /100 | #168 | Average 97.8% |
| Comanche | 53.8 /100 | #169 | Average 97.8% |
Demographics Similar to Spaniards by 3rd Grade
In terms of 3rd grade, the demographic groups most similar to Spaniards are Cambodian (97.9%, a difference of 0.0%), Immigrants from Romania (97.9%, a difference of 0.0%), Immigrants from Bulgaria (97.9%, a difference of 0.010%), Immigrants from Hungary (97.9%, a difference of 0.010%), and Immigrants from Kuwait (97.9%, a difference of 0.010%).
| Demographics | Rating | Rank | 3rd Grade |
| Immigrants | Serbia | 91.9 /100 | #129 | Exceptional 98.0% |
| Immigrants | Europe | 91.2 /100 | #130 | Exceptional 98.0% |
| Immigrants | Bulgaria | 89.1 /100 | #131 | Excellent 97.9% |
| Immigrants | Hungary | 88.8 /100 | #132 | Excellent 97.9% |
| Immigrants | Kuwait | 88.7 /100 | #133 | Excellent 97.9% |
| Seminole | 88.7 /100 | #134 | Excellent 97.9% |
| Cambodians | 88.1 /100 | #135 | Excellent 97.9% |
| Spaniards | 87.9 /100 | #136 | Excellent 97.9% |
| Immigrants | Romania | 87.9 /100 | #137 | Excellent 97.9% |
| Israelis | 86.6 /100 | #138 | Excellent 97.9% |
| Blackfeet | 86.3 /100 | #139 | Excellent 97.9% |
| Palestinians | 84.6 /100 | #140 | Excellent 97.9% |
| Immigrants | Turkey | 83.5 /100 | #141 | Excellent 97.9% |
| Hmong | 80.3 /100 | #142 | Excellent 97.9% |
| Filipinos | 79.9 /100 | #143 | Good 97.9% |